

[Mastering RCI!! Today's AUDJPY] Targeting a rebound at the moving average line that is being emphasized.
【Mastering RCI!! Trend Reversal, Buy the Dip, Sell the Rally】
Indicator【BODSOR・mBDSR】that shows strong power when combined with RCI
and methods & case studies (PDF) ★GogoJungle AWARD2020 winner★
https://www.gogojungle.co.jp/tools/indicators/11836
AUDJPY 5-minute chart
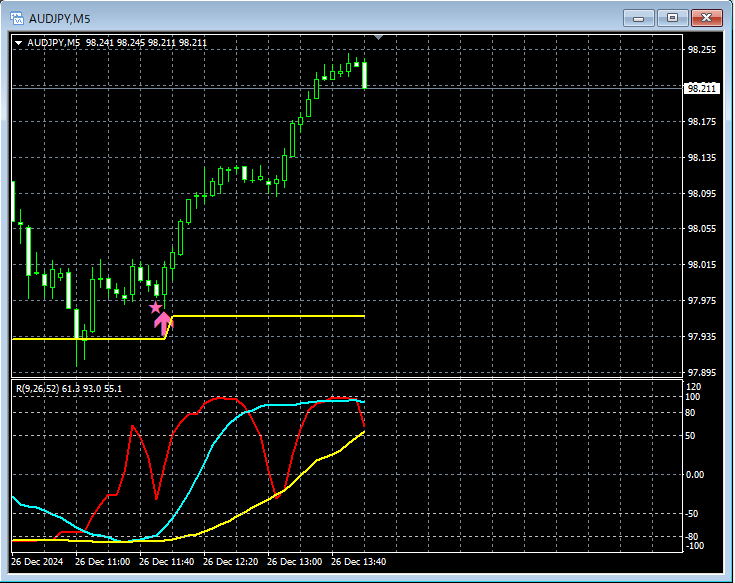
Looking at the 5-minute chart above, from the higher timeframe context it is considered important4-hour EMA21to have retraced toward an area and thenthe buy-the-dip signal of mBDSR (RCI two-line filter)lights up and the price rises firmly.
From this example,a trading method focused on price reaction at moving averagesandthe signal of mBDSRappear to be highly compatible.
※Please note that in the charts introduced in this article, for convenience of explanation, circles, straight lines, squares, etc. may be added.
Indicator【BODSOR・mBDSR】that shows strong power when combined with RCI
and methods & case studies (PDF) ★GogoJungle AWARD2020 winner★
https://www.gogojungle.co.jp/tools/indicators/11836
The PDF file contains 358 items (over 1,400 pages, over 470,000 characters).
Many of them are configurations that use the three-line RCI to logically link higher and lower timeframes, sequentially analyze the状況 of multiple lower timeframes, and ultimately wait for the timing of dips or rallies on the lower timeframes (i.e., the mBDSR signal).
Also,many emphasize identifying points where multiple entry rationale coincide.There are also many that focus on such coincidence.
Additionally,a method to explore upward and downward targets using the three-line RCI is included.Also included.
In the PDF explanations,more than 1,350 chartsare used.

Indicator【BODSOR・mBDSR】that shows strong power when combined with RCI
and methods & case studies (PDF) ★GogoJungle AWARD2020 winner★
https://www.gogojungle.co.jp/tools/indicators/11836
AUDJPY 5-minute chart
Looking at the 5-minute chart above, from the higher timeframe context it is considered important4-hour EMA21to have retraced toward an area and thenthe buy-the-dip signal of mBDSR (RCI two-line filter)lights up and the price rises firmly.
From this example,a trading method focused on price reaction at moving averagesandthe signal of mBDSRappear to be highly compatible.
※Please note that in the charts introduced in this article, for convenience of explanation, circles, straight lines, squares, etc. may be added.
Indicator【BODSOR・mBDSR】that shows strong power when combined with RCI
and methods & case studies (PDF) ★GogoJungle AWARD2020 winner★
https://www.gogojungle.co.jp/tools/indicators/11836
The PDF file contains 358 items (over 1,400 pages, over 470,000 characters).
Many of them are configurations that use the three-line RCI to logically link higher and lower timeframes, sequentially analyze the状況 of multiple lower timeframes, and ultimately wait for the timing of dips or rallies on the lower timeframes (i.e., the mBDSR signal).
Also,many emphasize identifying points where multiple entry rationale coincide.There are also many that focus on such coincidence.
Additionally,a method to explore upward and downward targets using the three-line RCI is included.Also included.
In the PDF explanations,more than 1,350 chartsare used.
× ![]()


