

Master RCI!! A double bottom and mBDSR buy signal on retreat
0
【Mastering RCI!! Trend Reversals, Buy the Dip, Sell the Bounce】
Indicator 【BODSOR・mBDSR】 that shines in combination with RCI
Methods and Case Studies (PDF) ★GogoJungle AWARD2020 winner★
https://www.gogojungle.co.jp/tools/indicators/11836
AUDCHF 1-hour (Australian Dollar/Swiss Franc)
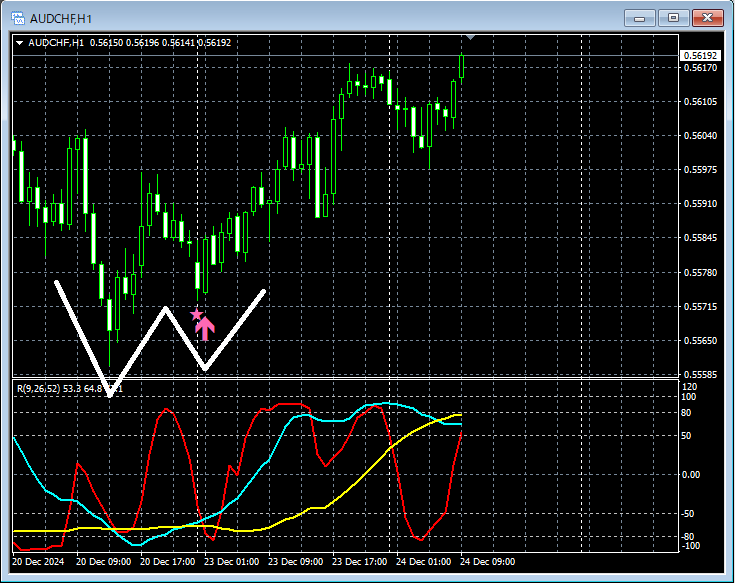
The higher-timeframe situation is omitted. In the 1-hour chart above,the right-side trough of a Double Bottomis wherethe mBDSR (two RCI lines) buy-the-dip signallights up. After the signal lights, the price is rising steadily.
From this example,a trading approach that focuses on Double Bottomandthe compatibility with the mBDSR signalcan be inferred.
※Please note that in the charts shown in this article, for convenience of explanation, circles, straight lines, and rectangles may be drawn.
Indicator 【BODSOR・mBDSR】 that shines in combination with RCI
Methods and Case Studies (PDF) ★GogoJungle AWARD2020 winner★
https://www.gogojungle.co.jp/tools/indicators/11836
The PDF file contains 358 items (over 1,400 pages, over 470,000 characters).
Many of them are summarized as examples that logically link higher and lower timeframes by using three RCI lines, sequentially examining multiple lower-timeframe conditions, and ultimately waiting for a dip-buy or a retrace-sell timing (the mBDSR signal) on the lower timeframe.
Additionally,many focus on identifying points where multiple entry reasons coincide.Also included are approaches that explore upside and downside targets using three RCI lines.
In the PDF explanations,
over 1,350 chartsare used.

Indicator 【BODSOR・mBDSR】 that shines in combination with RCI
Methods and Case Studies (PDF) ★GogoJungle AWARD2020 winner★
https://www.gogojungle.co.jp/tools/indicators/11836
AUDCHF 1-hour (Australian Dollar/Swiss Franc)
The higher-timeframe situation is omitted. In the 1-hour chart above,the right-side trough of a Double Bottomis wherethe mBDSR (two RCI lines) buy-the-dip signallights up. After the signal lights, the price is rising steadily.
From this example,a trading approach that focuses on Double Bottomandthe compatibility with the mBDSR signalcan be inferred.
※Please note that in the charts shown in this article, for convenience of explanation, circles, straight lines, and rectangles may be drawn.
Indicator 【BODSOR・mBDSR】 that shines in combination with RCI
Methods and Case Studies (PDF) ★GogoJungle AWARD2020 winner★
https://www.gogojungle.co.jp/tools/indicators/11836
The PDF file contains 358 items (over 1,400 pages, over 470,000 characters).
Many of them are summarized as examples that logically link higher and lower timeframes by using three RCI lines, sequentially examining multiple lower-timeframe conditions, and ultimately waiting for a dip-buy or a retrace-sell timing (the mBDSR signal) on the lower timeframe.
Additionally,many focus on identifying points where multiple entry reasons coincide.Also included are approaches that explore upside and downside targets using three RCI lines.
In the PDF explanations,
over 1,350 chartsare used.
× ![]()


