

[Master RCI!! Gold XAUUSD] Counter-trend line and mBDSR pullback buy signal
0
【Mastering RCI!! Trend Reversal, Buy on Dips, Sell on Rallies】
Indicator that shines in combination with RCI: 【BODSOR・mBDSR】
Methods and Case Studies (PDF) ★GogoJungle AWARD2020 Winner★
https://www.gogojungle.co.jp/tools/indicators/11836
Gold XAUUSD 1-minute chart
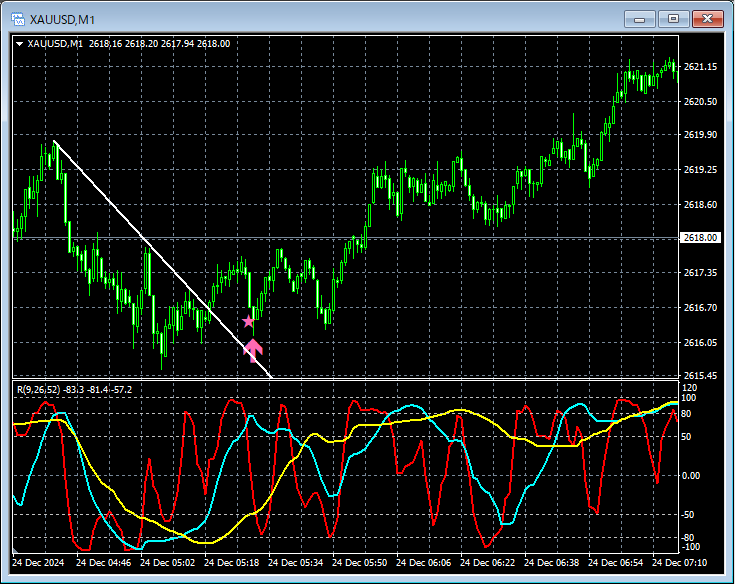
On the 1-minute chart above,the price broke above the Counter-Trend Lineand during the subsequent pullbackmBDSR (RCI two-line filter)buy signal lit up, and prices have risen smoothly thereafter.
From this example,the trade method focusing on the Counter-Trend Lineandthe signals of mBDSRshow a high degree of compatibility.
※Please note that in the charts introduced in this article, for convenience of explanation, circles, straight lines, squares, etc. may be drawn.
Indicator that shines in combination with RCI: 【BODSOR・mBDSR】
Methods and Case Studies (PDF) ★GogoJungle AWARD2020 Winner★
https://www.gogojungle.co.jp/tools/indicators/11836
The PDF file contains 358 items (over 1,400 pages, over 470,000 characters in total).
Many of these are a summary of examples that break down the situation on multiple lower time frames by linking higher and lower time frames logically using three RCI lines, and ultimately waiting for pullback buys in the lower time frames or pullback sells (i.e., signals from mBDSR).It also concentrates on points where multiple entry reasons overlap.
Additionally,there are methods that explore upside and downside targets using three RCI lines.
.
In the description within the PDF files,more than 1,350 chartsare used.

Indicator that shines in combination with RCI: 【BODSOR・mBDSR】
Methods and Case Studies (PDF) ★GogoJungle AWARD2020 Winner★
https://www.gogojungle.co.jp/tools/indicators/11836
Gold XAUUSD 1-minute chart
On the 1-minute chart above,the price broke above the Counter-Trend Lineand during the subsequent pullbackmBDSR (RCI two-line filter)buy signal lit up, and prices have risen smoothly thereafter.
From this example,the trade method focusing on the Counter-Trend Lineandthe signals of mBDSRshow a high degree of compatibility.
※Please note that in the charts introduced in this article, for convenience of explanation, circles, straight lines, squares, etc. may be drawn.
Indicator that shines in combination with RCI: 【BODSOR・mBDSR】
Methods and Case Studies (PDF) ★GogoJungle AWARD2020 Winner★
https://www.gogojungle.co.jp/tools/indicators/11836
The PDF file contains 358 items (over 1,400 pages, over 470,000 characters in total).
Many of these are a summary of examples that break down the situation on multiple lower time frames by linking higher and lower time frames logically using three RCI lines, and ultimately waiting for pullback buys in the lower time frames or pullback sells (i.e., signals from mBDSR).It also concentrates on points where multiple entry reasons overlap.
Additionally,there are methods that explore upside and downside targets using three RCI lines.
.
In the description within the PDF files,more than 1,350 chartsare used.
× ![]()


