

Break below the supported price and a pullback selling signal with mBDSR (RCI with 2-filters)
0
【Mastering RCI!! Trend Reversals, Buy on Dips, Sell on Rallies】
Indicator 【BODSOR・mBDSR】 which shows its power in combination with RCI
Methods & Case Studies (PDF) ★GogoJungle AWARD 2020 Recipient★
https://www.gogojungle.co.jp/tools/indicators/11836
CADJPY 5-minute chart
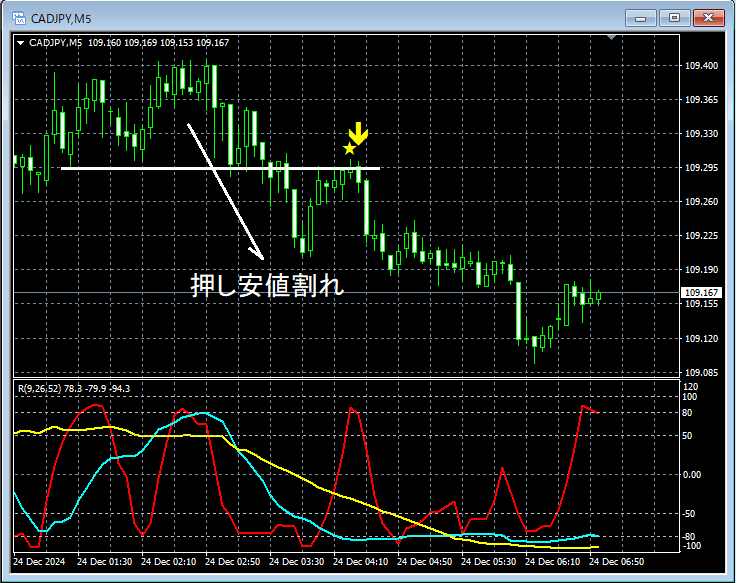
The status of the higher timeframes is omitted. On the 5-minute chart above,the price broke below the swing low(the uptrend was temporarily negated), and after the rise that followed,mBDSR (two RCI lines filter)sell signals appeared, and subsequently the price moved lower steadily.
From this example,a trading method focused on Dow Theoryandthe signals of mBDSRshow a strong compatibility.
※Please note that in this article, for convenience of explanation, charts may include added circles, lines, and rectangles.
Indicator 【BODSOR・mBDSR】 which shows its power in combination with RCI
Methods & Case Studies (PDF) ★GogoJungle AWARD 2020 Recipient★
https://www.gogojungle.co.jp/tools/indicators/11836
The PDF file comes with 358 items (over 1,400 pages, over 470,000 characters in total).
Many of them are designed as examples where multiple lower timeframe conditions are considered logically by linking upper and lower timeframes using three RCI lines, ultimately waiting for dip-buy signals or pullback-selling signals on the lower timeframes (i.e., mBDSR signals).
Additionally,many focus on pinpointing points where multiple entry reasons overlap.There are also many that focus on
note that,there are methods that explore upside and downside targets using three RCI lines.Also included.
In the explanation within the PDF files,more than 1,350 chartsare used.

Indicator 【BODSOR・mBDSR】 which shows its power in combination with RCI
Methods & Case Studies (PDF) ★GogoJungle AWARD 2020 Recipient★
https://www.gogojungle.co.jp/tools/indicators/11836
CADJPY 5-minute chart
The status of the higher timeframes is omitted. On the 5-minute chart above,the price broke below the swing low(the uptrend was temporarily negated), and after the rise that followed,mBDSR (two RCI lines filter)sell signals appeared, and subsequently the price moved lower steadily.
From this example,a trading method focused on Dow Theoryandthe signals of mBDSRshow a strong compatibility.
※Please note that in this article, for convenience of explanation, charts may include added circles, lines, and rectangles.
Indicator 【BODSOR・mBDSR】 which shows its power in combination with RCI
Methods & Case Studies (PDF) ★GogoJungle AWARD 2020 Recipient★
https://www.gogojungle.co.jp/tools/indicators/11836
The PDF file comes with 358 items (over 1,400 pages, over 470,000 characters in total).
Many of them are designed as examples where multiple lower timeframe conditions are considered logically by linking upper and lower timeframes using three RCI lines, ultimately waiting for dip-buy signals or pullback-selling signals on the lower timeframes (i.e., mBDSR signals).
Additionally,many focus on pinpointing points where multiple entry reasons overlap.There are also many that focus on
note that,there are methods that explore upside and downside targets using three RCI lines.Also included.
In the explanation within the PDF files,more than 1,350 chartsare used.
× ![]()


