

[RCI Strategy!!] Return rally high of the higher-ranked leg, the moving averages considered important, the head-and-shoulders, and the mBDSR return-sell signal
0
Indicator "BODSOR・mBDSR" that shows power in combination with RCI
Methods & Case Studies (PDF) ★GogoJungle AWARD2020 recipient★
https://www.gogojungle.co.jp/tools/indicators/11836
Oji Canada AUDCAD 15-minute chart
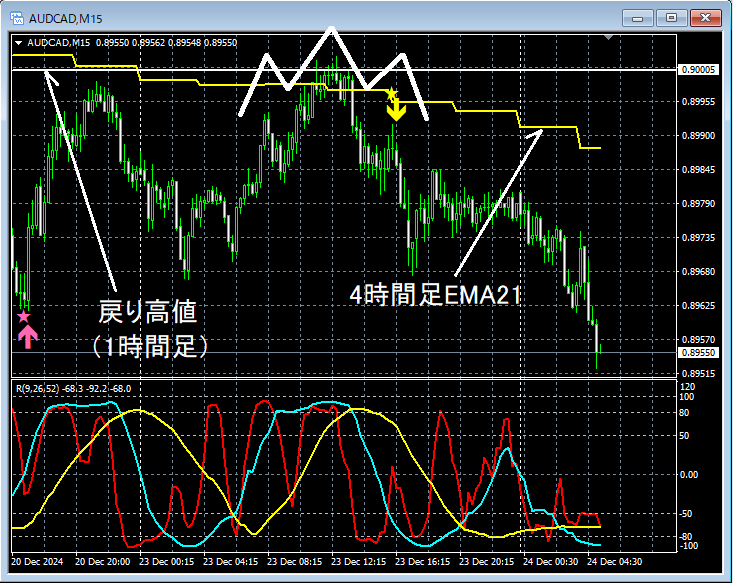
The situation of the higher timeframe is omitted. In the 15-minute chart above,the 1-hour timeframe retracement highand what is considered important in this casethe 4-hour EMA21could not clearly break above,forming a head-and-shouldersand turning down. As a result,a head-and-shoulderson the right shoulder of the patternmBDSR (2 RCI lines filter) oversell signallights up, forming a pattern.
From this example,the trading approach focusing on higher-timeframe retracement highs (Dow Theory), moving averages, and head-and-shouldersand thesignal of mBDSRshow a strong compatibility.
※ Please note that in the charts introduced in this article, for readability, circles, straight lines, and boxes may have been drawn.
Indicator "BODSOR・mBDSR" that shows power in combination with RCI
Methods & Case Studies (PDF) ★GogoJungle AWARD2020 recipient★
https://www.gogojungle.co.jp/tools/indicators/11836
The PDF file includes 358 documents (over 1,400 pages, over 470,000 characters).
Most of them are organized as examples where multiple lower-timeframe situations are logically linked to the higher-timeframe using 3 RCI lines, and ultimately waiting for a buying opportunity on pullbacks or selling opportunities on retracements (i.e., the mBDSR signal) on the lower timeframe.
Additionally,many of them emphasize identifying points where multiple entry reasons overlap.There are many that focus on overlapping-entry rationale.
Furthermore,there are methods that explore upside targets and downside targets using three RCI lines.Also included.
In the explanations within the PDF files,more than 1,350 chartsare used.

Methods & Case Studies (PDF) ★GogoJungle AWARD2020 recipient★
https://www.gogojungle.co.jp/tools/indicators/11836
Oji Canada AUDCAD 15-minute chart
The situation of the higher timeframe is omitted. In the 15-minute chart above,the 1-hour timeframe retracement highand what is considered important in this casethe 4-hour EMA21could not clearly break above,forming a head-and-shouldersand turning down. As a result,a head-and-shoulderson the right shoulder of the patternmBDSR (2 RCI lines filter) oversell signallights up, forming a pattern.
From this example,the trading approach focusing on higher-timeframe retracement highs (Dow Theory), moving averages, and head-and-shouldersand thesignal of mBDSRshow a strong compatibility.
※ Please note that in the charts introduced in this article, for readability, circles, straight lines, and boxes may have been drawn.
Indicator "BODSOR・mBDSR" that shows power in combination with RCI
Methods & Case Studies (PDF) ★GogoJungle AWARD2020 recipient★
https://www.gogojungle.co.jp/tools/indicators/11836
The PDF file includes 358 documents (over 1,400 pages, over 470,000 characters).
Most of them are organized as examples where multiple lower-timeframe situations are logically linked to the higher-timeframe using 3 RCI lines, and ultimately waiting for a buying opportunity on pullbacks or selling opportunities on retracements (i.e., the mBDSR signal) on the lower timeframe.
Additionally,many of them emphasize identifying points where multiple entry reasons overlap.There are many that focus on overlapping-entry rationale.
Furthermore,there are methods that explore upside targets and downside targets using three RCI lines.Also included.
In the explanations within the PDF files,more than 1,350 chartsare used.
× ![]()


