

Master RCI!! Return selling signal at the previous high, double top, and mBDSR retracement on higher time frame (3)
【MT5 Version Beta】 Has Been Released!!
mBDSR (Product ID 11836) Purchase Bonus】 MT5 Version Indicator (Beta) “mBDSR (No Filter, RCI Filter, MA Filter)”
https://www.gogojungle.co.jp/tools/indicators/56765
【Master RCI!! Trend Reversal, Buy on Dips, Sell on Retracements】
An indicator that shines when combined with RCI【BODSOR・mBDSR】
and its method and case study (PDF) ★Winner of GogoJungle AWARD2020★
https://www.gogojungle.co.jp/tools/indicators/11836
Dollar CAD USDCAD 1-Hour Chart
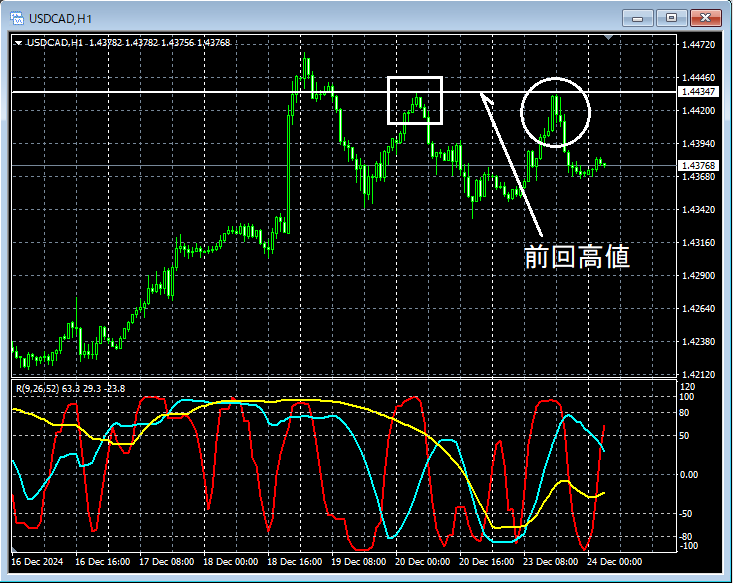
If you look at the area circled in white on the 1-hour chart above,the price has risen toward the previous highnearby, and it might be reasonable to expect a pullback. We will carefully watch on lower timeframes for signs of a pullback.
Dollar CAD USDCAD 5-Minute Chart
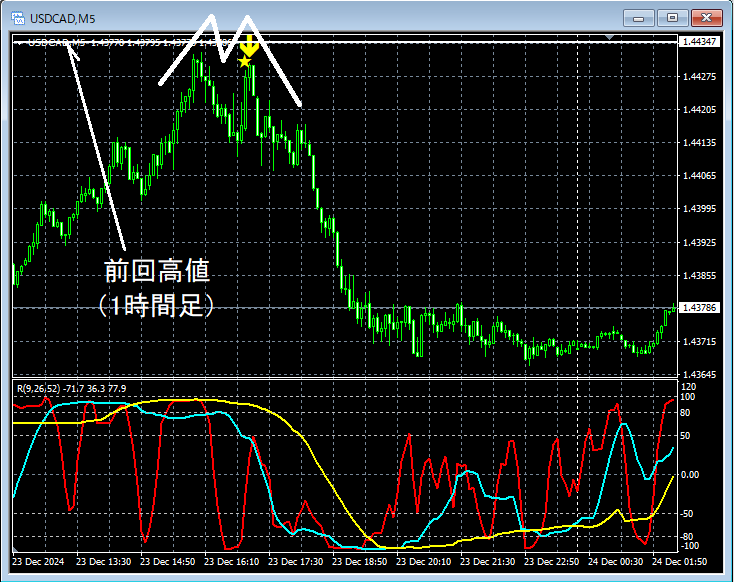
Looking at the 5-minute chart above,price rose toward the previous high on the 1-hour timeframeand then showed signs of pulling back. In the subsequent rise,the mBDSR (RCI double-filter) sell signallights up, and the price declines smoothly. As a result,a double topforms with the rightmost peak where the signal lit up.
Also, in this example, placing the stop-loss just abovethe recent highallows for a high risk-reward trade.
From this example,the high compatibility between trades that focus on the previous high of the higher timeframe and double tops,andthe signals of mBDSRis evident.
※Note: In this article, charts shown may have added circles, lines, or rectangles for explanation purposes, please understand.
An indicator that shines with RCI in combination【BODSOR・mBDSR】
and its method and case study (PDF) ★Winner of GogoJungle AWARD2020★
https://www.gogojungle.co.jp/tools/indicators/11836
The PDF file includes 358 documents (over 1,400 pages, over 470,000 words).
Many of these are about logically linking higher and lower timeframes using three RCI lines, gradually examining multiple lower-timeframe conditions, and ultimately waiting for the timing of dip buying or pullbacks on the lower timeframe (i.e., mBDSR signals).
Also,many focus on identifying overlapping entry signals at critical points.There are a lot of these.
Additionally,techniques using three RCI lines to explore upside and downside targetsare included.
In the PDF explanations,more than 1,350 chartsare used.

mBDSR (Product ID 11836) Purchase Bonus】 MT5 Version Indicator (Beta) “mBDSR (No Filter, RCI Filter, MA Filter)”
https://www.gogojungle.co.jp/tools/indicators/56765
【Master RCI!! Trend Reversal, Buy on Dips, Sell on Retracements】
An indicator that shines when combined with RCI【BODSOR・mBDSR】
and its method and case study (PDF) ★Winner of GogoJungle AWARD2020★
https://www.gogojungle.co.jp/tools/indicators/11836
Dollar CAD USDCAD 1-Hour Chart
If you look at the area circled in white on the 1-hour chart above,the price has risen toward the previous highnearby, and it might be reasonable to expect a pullback. We will carefully watch on lower timeframes for signs of a pullback.
Dollar CAD USDCAD 5-Minute Chart
Looking at the 5-minute chart above,price rose toward the previous high on the 1-hour timeframeand then showed signs of pulling back. In the subsequent rise,the mBDSR (RCI double-filter) sell signallights up, and the price declines smoothly. As a result,a double topforms with the rightmost peak where the signal lit up.
Also, in this example, placing the stop-loss just abovethe recent highallows for a high risk-reward trade.
From this example,the high compatibility between trades that focus on the previous high of the higher timeframe and double tops,andthe signals of mBDSRis evident.
※Note: In this article, charts shown may have added circles, lines, or rectangles for explanation purposes, please understand.
An indicator that shines with RCI in combination【BODSOR・mBDSR】
and its method and case study (PDF) ★Winner of GogoJungle AWARD2020★
https://www.gogojungle.co.jp/tools/indicators/11836
The PDF file includes 358 documents (over 1,400 pages, over 470,000 words).
Many of these are about logically linking higher and lower timeframes using three RCI lines, gradually examining multiple lower-timeframe conditions, and ultimately waiting for the timing of dip buying or pullbacks on the lower timeframe (i.e., mBDSR signals).
Also,many focus on identifying overlapping entry signals at critical points.There are a lot of these.
Additionally,techniques using three RCI lines to explore upside and downside targetsare included.
In the PDF explanations,more than 1,350 chartsare used.
× ![]()


