

Mastering RCI!! Bitcoin A Break Above the Previous High and the Buy-the-Dall Down Signal with mBDSR (RCI Two-Filters)
【Mastering RCI!! Trend Reversal, Buy the Dip, Sell the Pullback】
Indicator that shines in combination with RCI: 【BODSOR・mBDSR】
Methods and case studies (PDF) ★GogoJungle AWARD 2020 winner★
https://www.gogojungle.co.jp/tools/indicators/11836
Bitcoin / USD BTCUSD 5-minute chart
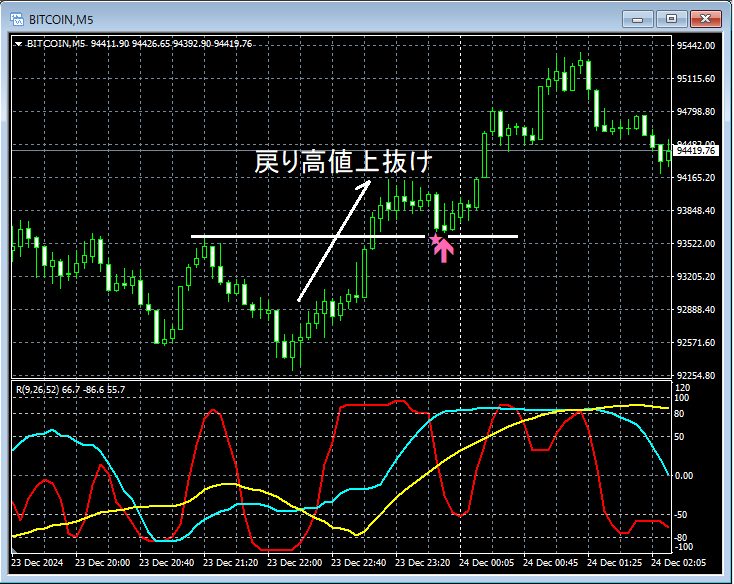
On the above 5-minute chart, it rebounds from a downtrend. Andpullback highAfter breaking above,pullback highcomes down near themBDSR (filter: RCI26 and RCI52) buy signallights up and the price steadily rises.
From this example,a trading approach focused on pullback highs (Dow Theory)andthe signals of mBDSRshow a high degree of compatibility.
Note: In the charts introduced in this article, for convenience of explanation, circles, lines, and rectangles may be added, so please understand.
Indicator that shines in combination with RCI: 【BODSOR・mBDSR】
Methods and case studies (PDF) ★GogoJungle AWARD2020 winner★
https://www.gogojungle.co.jp/tools/indicators/11836
The PDF file includes 358 files (over 1,400 pages, over 470,000 characters).
Many of them areexamples that logically link higher and lower timeframes using the RCI3 lines, sequentially considering multiple lower-timeframe conditions, and ultimately waiting for the timing of buy the dip or sell the rally on the lower timeframes (i.e., the mBDSR signal)..
Also,many focus on identifying points where multiple entry reasons coincide..
Furthermore,there are methods that explore upward and downward targets using the RCI3 lines..
In the PDF explanations,over 1,350 chartsare used.

Indicator that shines in combination with RCI: 【BODSOR・mBDSR】
Methods and case studies (PDF) ★GogoJungle AWARD 2020 winner★
https://www.gogojungle.co.jp/tools/indicators/11836
Bitcoin / USD BTCUSD 5-minute chart
On the above 5-minute chart, it rebounds from a downtrend. Andpullback highAfter breaking above,pullback highcomes down near themBDSR (filter: RCI26 and RCI52) buy signallights up and the price steadily rises.
From this example,a trading approach focused on pullback highs (Dow Theory)andthe signals of mBDSRshow a high degree of compatibility.
Note: In the charts introduced in this article, for convenience of explanation, circles, lines, and rectangles may be added, so please understand.
Indicator that shines in combination with RCI: 【BODSOR・mBDSR】
Methods and case studies (PDF) ★GogoJungle AWARD2020 winner★
https://www.gogojungle.co.jp/tools/indicators/11836
The PDF file includes 358 files (over 1,400 pages, over 470,000 characters).
Many of them areexamples that logically link higher and lower timeframes using the RCI3 lines, sequentially considering multiple lower-timeframe conditions, and ultimately waiting for the timing of buy the dip or sell the rally on the lower timeframes (i.e., the mBDSR signal)..
Also,many focus on identifying points where multiple entry reasons coincide..
Furthermore,there are methods that explore upward and downward targets using the RCI3 lines..
In the PDF explanations,over 1,350 chartsare used.
× ![]()


