

[Master RCI!! Gold XAUUSD] Prominent lows, double top, and mBDSR rebound/sell signal
【Mastering RCI!! Trend Reversal, Buy the Dip, Sell the Retrace】
Indicator that shines in combination with RCI: 【BODSOR・mBDSR】
and methods & case studies (PDF) ★GogoJungle AWARD 2020 winner★
https://www.gogojungle.co.jp/tools/indicators/11836
Gold XAUUSD 4-hour chart
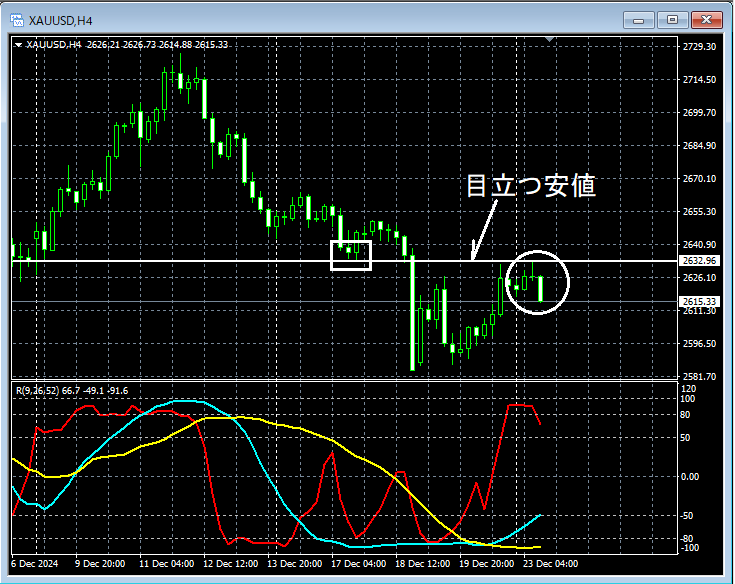
On the 4-hour chart above, first focus on a prominent low that may act as resistancenoticeable lowin the area circled with a white circle. This is a situation where the price has risen to near thisnoticeable lowand may reverse downward, so it wouldn’t be surprising to consider a pullback. We will carefully look for signs of a pullback on lower timeframes.
Gold XAUUSD 5-minute chart
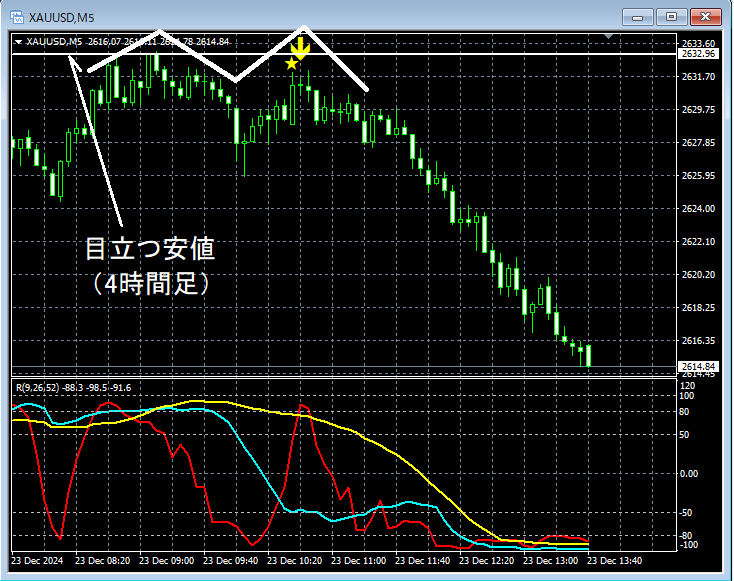
On the 5-minute chart above,near the prominent low at the 4-hour levelit rises and then seems to reverse. After that,mBDSR(RCI two-filter)sell signal appears and the price moves firmly downward.
As a result,a double topshows a well-timed start of the decline on the right-hand peak.
From this example,a trading method that focuses on noticeable lows and double topsandthe signals from mBDSRdemonstrate strong compatibility.
Also in this example, placing the stop-loss just slightly above the recent high (left peak of the double top)allows for a favorable risk-reward tradeopportunity.
※Please note that in this article’s charts, for convenience of explanation, circles, lines, and rectangles may have been added.
Indicator that shines in combination with RCI: 【BODSOR・mBDSR】
and methods & case studies (PDF) ★GogoJungle AWARD 2020 winner★
https://www.gogojungle.co.jp/tools/indicators/11836
The PDF file includes 358 items (over 1,400 pages, over 470,000 characters in total).
Most of these area collection of examples showing how to logically link higher and lower timeframes using the RCI three-line setup, then sequentially analyze multiple lower timeframes, ultimately waiting for pullbacks or continuation signals on the lower timeframes (i.e., mBDSR signals).a collection of examples showing how to logically link higher and lower timeframes using the RCI three-line setup, then sequentially analyze multiple lower timeframes, ultimately waiting for pullbacks or continuation signals on the lower timeframes (i.e., mBDSR signals)..
Also,many entries focus on overlapping multiple entry rationales..
Additionally,there is content on exploring upside targets and downside targets using the three-line RCI method..
In the PDF explanations,over 1,350 chartsare used.

Indicator that shines in combination with RCI: 【BODSOR・mBDSR】
and methods & case studies (PDF) ★GogoJungle AWARD 2020 winner★
https://www.gogojungle.co.jp/tools/indicators/11836
Gold XAUUSD 4-hour chart
On the 4-hour chart above, first focus on a prominent low that may act as resistancenoticeable lowin the area circled with a white circle. This is a situation where the price has risen to near thisnoticeable lowand may reverse downward, so it wouldn’t be surprising to consider a pullback. We will carefully look for signs of a pullback on lower timeframes.
Gold XAUUSD 5-minute chart
On the 5-minute chart above,near the prominent low at the 4-hour levelit rises and then seems to reverse. After that,mBDSR(RCI two-filter)sell signal appears and the price moves firmly downward.
As a result,a double topshows a well-timed start of the decline on the right-hand peak.
From this example,a trading method that focuses on noticeable lows and double topsandthe signals from mBDSRdemonstrate strong compatibility.
Also in this example, placing the stop-loss just slightly above the recent high (left peak of the double top)allows for a favorable risk-reward tradeopportunity.
※Please note that in this article’s charts, for convenience of explanation, circles, lines, and rectangles may have been added.
Indicator that shines in combination with RCI: 【BODSOR・mBDSR】
and methods & case studies (PDF) ★GogoJungle AWARD 2020 winner★
https://www.gogojungle.co.jp/tools/indicators/11836
The PDF file includes 358 items (over 1,400 pages, over 470,000 characters in total).
Most of these area collection of examples showing how to logically link higher and lower timeframes using the RCI three-line setup, then sequentially analyze multiple lower timeframes, ultimately waiting for pullbacks or continuation signals on the lower timeframes (i.e., mBDSR signals).a collection of examples showing how to logically link higher and lower timeframes using the RCI three-line setup, then sequentially analyze multiple lower timeframes, ultimately waiting for pullbacks or continuation signals on the lower timeframes (i.e., mBDSR signals)..
Also,many entries focus on overlapping multiple entry rationales..
Additionally,there is content on exploring upside targets and downside targets using the three-line RCI method..
In the PDF explanations,over 1,350 chartsare used.
× ![]()


