

Mastering RCI!! Recent Pound-Dollar: Prominent lows, double top, and mBDSR return-sell signals
【Mastering RCI!! Trend Reversal, Buy the Dip, and Sell the Rally】
Indicator that shines when used with RCI: 【BODSOR・mBDSR】
Method and Case Studies (PDF) ★GogoJungle AWARD2020 winner★
https://www.gogojungle.co.jp/tools/indicators/11836
GBP/USD 4-hour chart
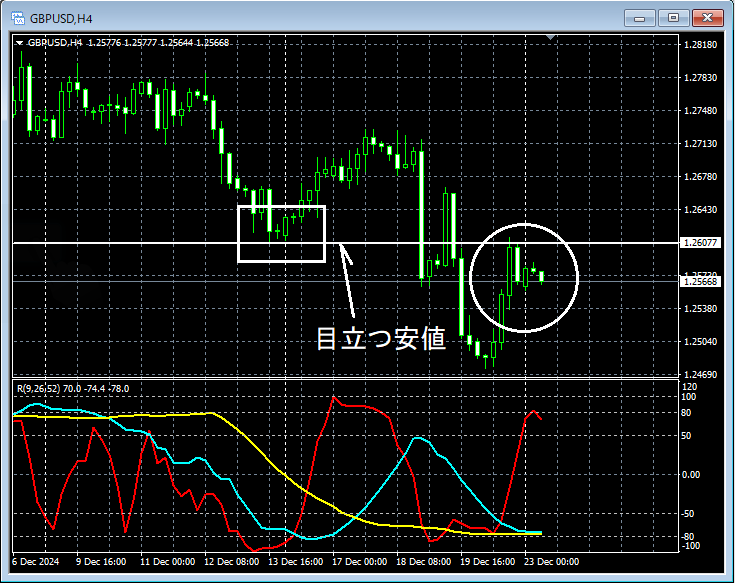
In the four-hour chart above, note the apparent resistance levelprominent lowaround which the price has risen to near this area circled in white, making a pullback possible. We will carefully monitor for signs of reversal on lower timeframes.
GBP/USD 15-minute chart
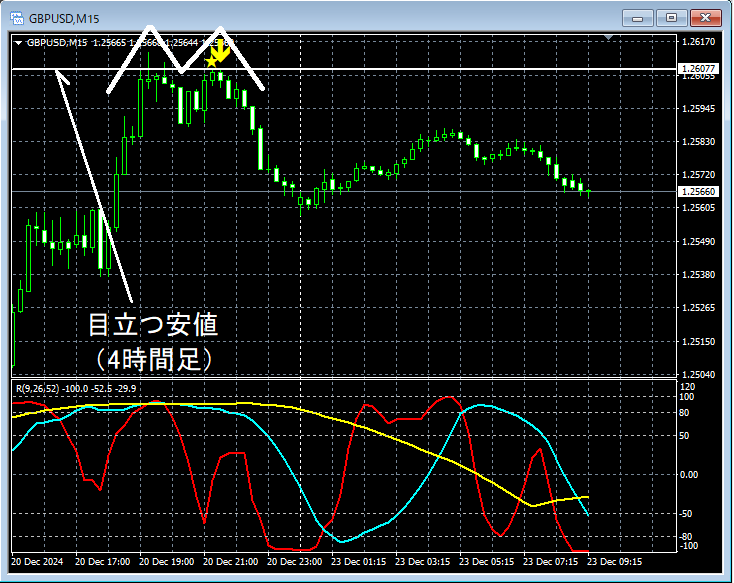
On the above 5-minute chart,near the prominent low on the 4-hour chartthe price rises close to it and then shows a reversal tendency. Subsequently,mBDSR (two RCI filters)sell signals light up, and the price declines firmly.
As a result,a double topthe timing of the decline on the right peak is captured effectively.
From this example,a trading method that focuses on prominent lows and double topsandthe signals of mBDSRappear to be highly compatible.
Also in this example, you can place the stop-loss slightly above the recent high (left peak of the double top)to achieve a favorable risk-reward trade.
※ Please note that in the charts introduced in this article, for convenience, there may be added circles, lines, rectangles, etc.
Indicator that shines when used with RCI: 【BODSOR・mBDSR】
Method and Case Studies (PDF) ★GogoJungle AWARD2020 winner★
https://www.gogojungle.co.jp/tools/indicators/11836
The PDF file includes 358 files (over 1,400 pages, well over 470,000 characters).
Many of them areexamples that examine multiple lower-timeframe conditions by logically linking higher and lower timeframes using the three-line RCI, ultimately embedding a timing for dips or pullbacks on the lower timeframe (i.e., mBDSR signals)..
Additionally,there are many cases focusing on aligning multiple entry reasons..
Furthermore,there are methods that explore ascent and downside targets using the three-line RCI..
In the PDF explanations,more than 1,350 chartsare used.

Indicator that shines when used with RCI: 【BODSOR・mBDSR】
Method and Case Studies (PDF) ★GogoJungle AWARD2020 winner★
https://www.gogojungle.co.jp/tools/indicators/11836
GBP/USD 4-hour chart
In the four-hour chart above, note the apparent resistance levelprominent lowaround which the price has risen to near this area circled in white, making a pullback possible. We will carefully monitor for signs of reversal on lower timeframes.
GBP/USD 15-minute chart
On the above 5-minute chart,near the prominent low on the 4-hour chartthe price rises close to it and then shows a reversal tendency. Subsequently,mBDSR (two RCI filters)sell signals light up, and the price declines firmly.
As a result,a double topthe timing of the decline on the right peak is captured effectively.
From this example,a trading method that focuses on prominent lows and double topsandthe signals of mBDSRappear to be highly compatible.
Also in this example, you can place the stop-loss slightly above the recent high (left peak of the double top)to achieve a favorable risk-reward trade.
※ Please note that in the charts introduced in this article, for convenience, there may be added circles, lines, rectangles, etc.
Indicator that shines when used with RCI: 【BODSOR・mBDSR】
Method and Case Studies (PDF) ★GogoJungle AWARD2020 winner★
https://www.gogojungle.co.jp/tools/indicators/11836
The PDF file includes 358 files (over 1,400 pages, well over 470,000 characters).
Many of them areexamples that examine multiple lower-timeframe conditions by logically linking higher and lower timeframes using the three-line RCI, ultimately embedding a timing for dips or pullbacks on the lower timeframe (i.e., mBDSR signals)..
Additionally,there are many cases focusing on aligning multiple entry reasons..
Furthermore,there are methods that explore ascent and downside targets using the three-line RCI..
In the PDF explanations,more than 1,350 chartsare used.
× ![]()


