

Master RCI! Mastering RCI: Counter-trend line and mBDSR reversal sell signal
【Mastering RCI!! Trend Reversal, Buy on Dips, Sell on Rallies】
Indicator 【BODSOR・mBDSR】 that shines in combination with RCI
Methods and Case Studies (PDF) ★GogoJungle AWARD 2020 recipient★
https://www.gogojungle.co.jp/tools/indicators/11836
USD/CAD USDCAD 5-minute chart
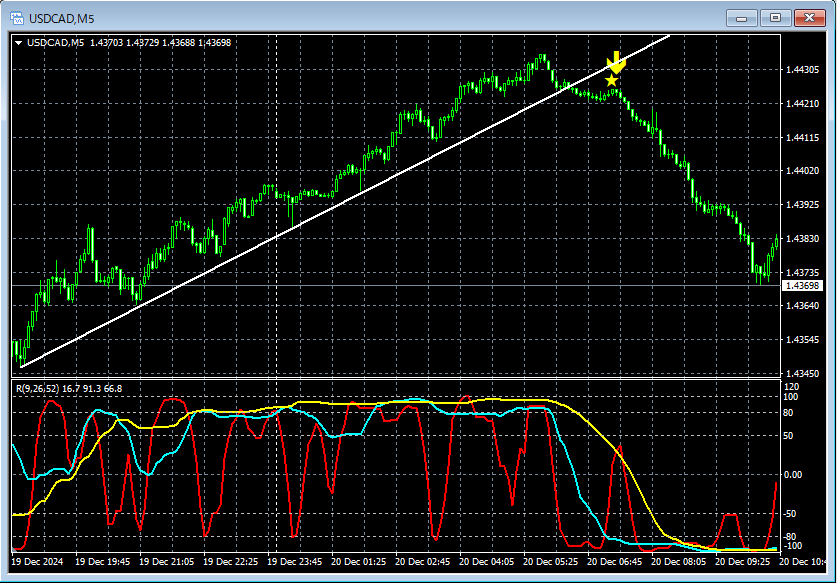
Looking at the 5-minute chart above,Counter-trend linewas broken downward. After that,mBDSR's (two RCI filters) Sell signallit up and the price moved significantly lower.
From this example,a trading method focused on the counter-trend lineandthe signal from mBDSRshow a strong compatibility.
※Please note that in this article’s charts, for convenience of explanation we may have added circles, straight lines, or rectangles.
Indicator that shines in combination with RCI【BODSOR・mBDSR】
Methods and Case Studies (PDF) ★GogoJungle AWARD 2020 recipient★
https://www.gogojungle.co.jp/tools/indicators/11836
The PDF file includes 358 items (over 1,400 pages, over 470,000 characters).
Many of these are summaries of examples that use three RCI lines to logically link higher and lower timeframes, examining multiple lower-timeframe situations sequentially and eventually waiting for dip-buying or pullback selling timings (i.e., mBDSR signals) on the lower timeframe.
Additionally,there is a focus on capturing points where multiple entry reasons coincide.There are many such cases.
Furthermore,the method also includes using three RCI lines to explore upside and downside targets.It is included.
In the PDF explanation,more than 1,350 chartsare used.

Indicator 【BODSOR・mBDSR】 that shines in combination with RCI
Methods and Case Studies (PDF) ★GogoJungle AWARD 2020 recipient★
https://www.gogojungle.co.jp/tools/indicators/11836
USD/CAD USDCAD 5-minute chart
Looking at the 5-minute chart above,Counter-trend linewas broken downward. After that,mBDSR's (two RCI filters) Sell signallit up and the price moved significantly lower.
From this example,a trading method focused on the counter-trend lineandthe signal from mBDSRshow a strong compatibility.
※Please note that in this article’s charts, for convenience of explanation we may have added circles, straight lines, or rectangles.
Indicator that shines in combination with RCI【BODSOR・mBDSR】
Methods and Case Studies (PDF) ★GogoJungle AWARD 2020 recipient★
https://www.gogojungle.co.jp/tools/indicators/11836
The PDF file includes 358 items (over 1,400 pages, over 470,000 characters).
Many of these are summaries of examples that use three RCI lines to logically link higher and lower timeframes, examining multiple lower-timeframe situations sequentially and eventually waiting for dip-buying or pullback selling timings (i.e., mBDSR signals) on the lower timeframe.
Additionally,there is a focus on capturing points where multiple entry reasons coincide.There are many such cases.
Furthermore,the method also includes using three RCI lines to explore upside and downside targets.It is included.
In the PDF explanation,more than 1,350 chartsare used.
× ![]()


