

Mastering RCI!! Euro-Dollar from last Friday on the higher timeframe: The previous low on the higher timeframe and the mBDSR pullback buy signal
【Mastering RCI!! Trend Reversal, Buy on Dip, Sell on Rally】
Indicator 【BODSOR・mBDSR】 that demonstrates power when combined with RCI
and method & case studies (PDF) ★GogoJungle AWARD 2020 winner★
https://www.gogojungle.co.jp/tools/indicators/11836
Euro Dollar EURUSD 15-minute chart
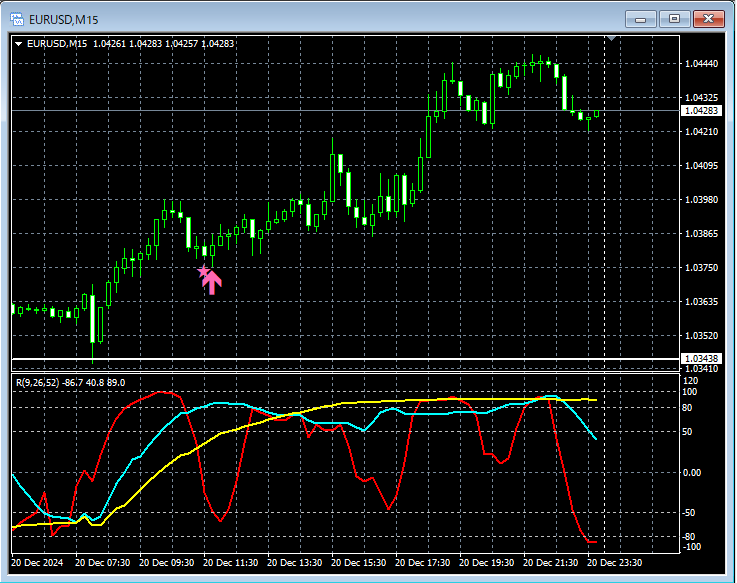
The situation on the higher timeframe is omitted. On the upper 15-minute chart,the previous low on the higher timeframeis near the level where it tends to rebound. After that,the buy-on-dip signal of mBDSR (RCI two-filter)lights up, and the price rises smoothly.
From this example,a trading method focused on the previous low of the higher timeframeandthe signals of mBDSRshow a high degree of synergy.
※Please note that in the charts introduced in this article, for convenience of explanation, circles, straight lines, squares, etc. may be added.
Indicator 【BODSOR・mBDSR】 that demonstrates power when combined with RCI
and method & case studies (PDF) ★GogoJungle AWARD 2020 winner★
https://www.gogojungle.co.jp/tools/indicators/11836
The PDF file comes with 358 items (over 1,400 pages, over 470,000 characters in total).
Many of them areexamples that logically link higher and lower timeframes using the RCI three-line method, gradually examining multiple lower-timeframe conditions and ultimately waiting for buy-on-dip or sell-on-rally timings (=mBDSR signals) on the lower timeframe.
Also,many emphasize capturing points where multiple entry reasons coincide..
In addition,it also includes methods to explore upside and downside targets using the RCI three-line method..
In the description within the PDF files,more than 1,350 chartsare used.

Indicator 【BODSOR・mBDSR】 that demonstrates power when combined with RCI
and method & case studies (PDF) ★GogoJungle AWARD 2020 winner★
https://www.gogojungle.co.jp/tools/indicators/11836
Euro Dollar EURUSD 15-minute chart
The situation on the higher timeframe is omitted. On the upper 15-minute chart,the previous low on the higher timeframeis near the level where it tends to rebound. After that,the buy-on-dip signal of mBDSR (RCI two-filter)lights up, and the price rises smoothly.
From this example,a trading method focused on the previous low of the higher timeframeandthe signals of mBDSRshow a high degree of synergy.
※Please note that in the charts introduced in this article, for convenience of explanation, circles, straight lines, squares, etc. may be added.
Indicator 【BODSOR・mBDSR】 that demonstrates power when combined with RCI
and method & case studies (PDF) ★GogoJungle AWARD 2020 winner★
https://www.gogojungle.co.jp/tools/indicators/11836
The PDF file comes with 358 items (over 1,400 pages, over 470,000 characters in total).
Many of them areexamples that logically link higher and lower timeframes using the RCI three-line method, gradually examining multiple lower-timeframe conditions and ultimately waiting for buy-on-dip or sell-on-rally timings (=mBDSR signals) on the lower timeframe.
Also,many emphasize capturing points where multiple entry reasons coincide..
In addition,it also includes methods to explore upside and downside targets using the RCI three-line method..
In the description within the PDF files,more than 1,350 chartsare used.
× ![]()


