

Master RCI!! The Dollar/Yen from last Friday: Double bottom and mBDSR pullback buying signal
【Mastering RCI!! Trend Reversal, Buy the Dip, and Sell the Rally】
Indicator that shines in combination with RCI: 【BODSOR・mBDSR】
Methods and Case Studies (PDF) ★GogoJungle AWARD2020 winner★
https://www.gogojungle.co.jp/tools/indicators/11836
USD/JPY 15-minute chart
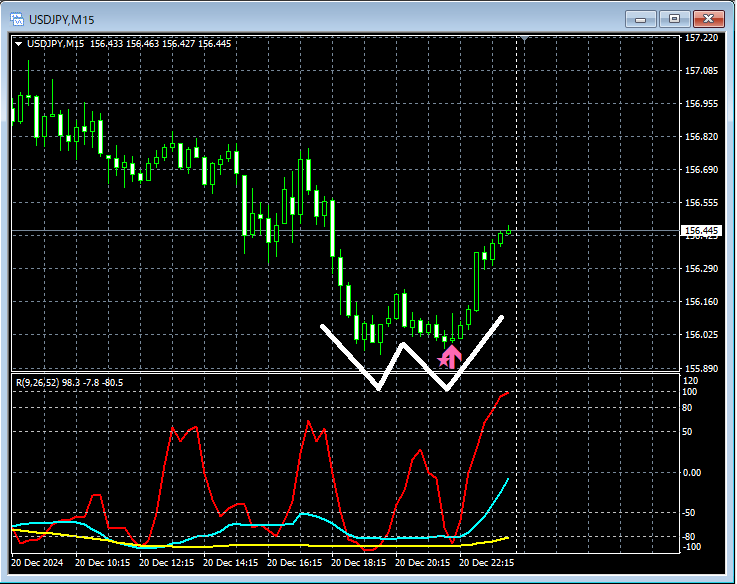
On the 15-minute chart above,the right-side valley of the Double Bottomshows the lighting up lighting up. After the signal lights up, the price has been rising steadily.
From this example,a trading approach focusing on the double bottomandthe signal of mBDSRshow a strong synergy.
Additionally, in this example, by placing the stop-loss just slightly below the most recent low (the left valley of the double bottom),high-risk-reward tradesbecome possible.
※Please note that in the charts introduced in this article, for convenience in explanation, circles, straight lines, and squares may be drawn.
Indicator that shines in combination with RCI【BODSOR・mBDSR】
Methods and Case Studies (PDF) ★GogoJungle AWARD2020 winner★
https://www.gogojungle.co.jp/tools/indicators/11836
The PDF file includes 358 documents (over 1,400 pages, over 470,000 characters).
Many of theseexplain how to logically link higher Time Frames and lower Time Frames using the RCI three-line, and systematically examine multiple lower-time-frame conditions, ultimately waiting for dip-buying or rally-selling timing (i.e., the mBDSR signals) on the lower time frames..
Additionally,many focus on capturing points where multiple entry reasons overlap..
Also included are techniques for exploring upside and downside targets using the RCI three-line.
In the descriptions within the PDF files,more than 1,350 chartsare used.

Indicator that shines in combination with RCI: 【BODSOR・mBDSR】
Methods and Case Studies (PDF) ★GogoJungle AWARD2020 winner★
https://www.gogojungle.co.jp/tools/indicators/11836
USD/JPY 15-minute chart
On the 15-minute chart above,the right-side valley of the Double Bottomshows the lighting up lighting up. After the signal lights up, the price has been rising steadily.
From this example,a trading approach focusing on the double bottomandthe signal of mBDSRshow a strong synergy.
Additionally, in this example, by placing the stop-loss just slightly below the most recent low (the left valley of the double bottom),high-risk-reward tradesbecome possible.
※Please note that in the charts introduced in this article, for convenience in explanation, circles, straight lines, and squares may be drawn.
Indicator that shines in combination with RCI【BODSOR・mBDSR】
Methods and Case Studies (PDF) ★GogoJungle AWARD2020 winner★
https://www.gogojungle.co.jp/tools/indicators/11836
The PDF file includes 358 documents (over 1,400 pages, over 470,000 characters).
Many of theseexplain how to logically link higher Time Frames and lower Time Frames using the RCI three-line, and systematically examine multiple lower-time-frame conditions, ultimately waiting for dip-buying or rally-selling timing (i.e., the mBDSR signals) on the lower time frames..
Additionally,many focus on capturing points where multiple entry reasons overlap..
Also included are techniques for exploring upside and downside targets using the RCI three-line.
In the descriptions within the PDF files,more than 1,350 chartsare used.
× ![]()


