

Today’s USD/JPY (2024/12/20) Noon Fix Trade mBDSR (RCI2-band filter) exhaustion/sell signal
【Mastering RCI!! Trend Reversal, Buy the Dip, Selling on Rallies】
Indicator that shines when combined with RCI【BODSOR・mBDSR】
and techniques・case studies (PDF) ★GogoJungle AWARD2020 winner★
https://www.gogojungle.co.jp/tools/indicators/11836
USD/JPY 1-minute chart
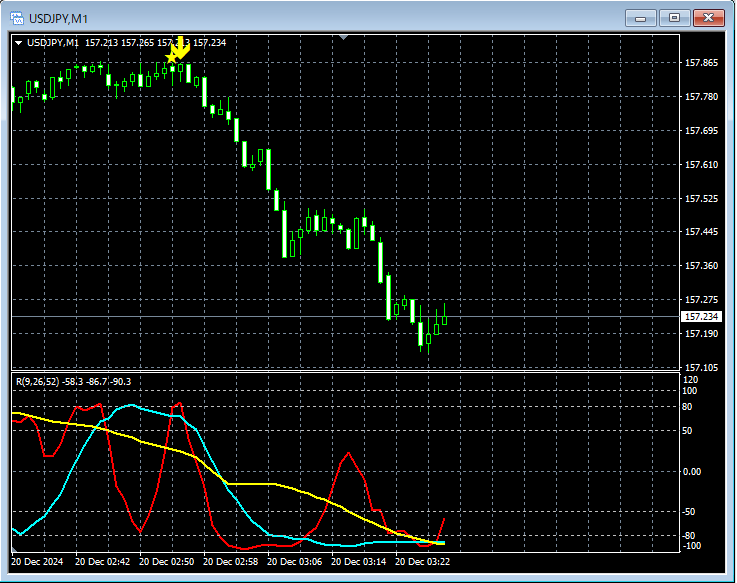
Looking at the 1-minute chart above,during the Tokyo fixthere isa sell signal on the mBDSR (RCI two-line filter)lighting up, and the price drops sharply.
From this example,a trading method that focuses on the decline after the Tokyo fixandthe harmony with mBDSR signalscan be observed.
※Please note that the charts introduced in this article may have added circles, lines, or rectangles for explanatory convenience.
Indicator that shines when combined with RCI【BODSOR・mBDSR】
and techniques・case studies (PDF) ★GogoJungle AWARD2020 winner★
https://www.gogojungle.co.jp/tools/indicators/11836
The PDF file includes 358 files (over 1,400 pages, over 470,000 characters in total).
Many of them are summaries of cases where, by using the RCI three-line setup to logically link higher and lower timeframes, multiple lower-timeframe situations are considered sequentially, ultimately waiting for dip-buying or selling-on-rallies timing (i.e., mBDSR signals) on the lower timeframe.In addition,
many focus on identifying points where multiple entry reasons overlap.There are also many that explore upside and downside targets using the three-line RCI method.
In the description of the PDF files,
more than 1,350 chartsare used.

Indicator that shines when combined with RCI【BODSOR・mBDSR】
and techniques・case studies (PDF) ★GogoJungle AWARD2020 winner★
https://www.gogojungle.co.jp/tools/indicators/11836
USD/JPY 1-minute chart
Looking at the 1-minute chart above,during the Tokyo fixthere isa sell signal on the mBDSR (RCI two-line filter)lighting up, and the price drops sharply.
From this example,a trading method that focuses on the decline after the Tokyo fixandthe harmony with mBDSR signalscan be observed.
※Please note that the charts introduced in this article may have added circles, lines, or rectangles for explanatory convenience.
Indicator that shines when combined with RCI【BODSOR・mBDSR】
and techniques・case studies (PDF) ★GogoJungle AWARD2020 winner★
https://www.gogojungle.co.jp/tools/indicators/11836
The PDF file includes 358 files (over 1,400 pages, over 470,000 characters in total).
Many of them are summaries of cases where, by using the RCI three-line setup to logically link higher and lower timeframes, multiple lower-timeframe situations are considered sequentially, ultimately waiting for dip-buying or selling-on-rallies timing (i.e., mBDSR signals) on the lower timeframe.In addition,
many focus on identifying points where multiple entry reasons overlap.There are also many that explore upside and downside targets using the three-line RCI method.
In the description of the PDF files,
more than 1,350 chartsare used.
× ![]()


