

Mastering RCI!! Sign of pullback buy in USD/JPY last week using mBDSR (Moving Average Filter)
【Mastering RCI!! Trend Reversal, Buy on Dips, Sell on Rallies】
Indicator【BODSOR・mBDSR】 that shines when used with RCI
and methods & case studies (PDF) ★GogoJungle AWARD2020 winner★
https://www.gogojungle.co.jp/tools/indicators/11836
mBDSR (RCI filter)andmBDSR (Moving Average filter)serve different roles. The differences in usage are also discussed in the above PDF.
Below,mBDSR (Moving Average filter)sign examples will be introduced.
USD/JPY 4-hour chart
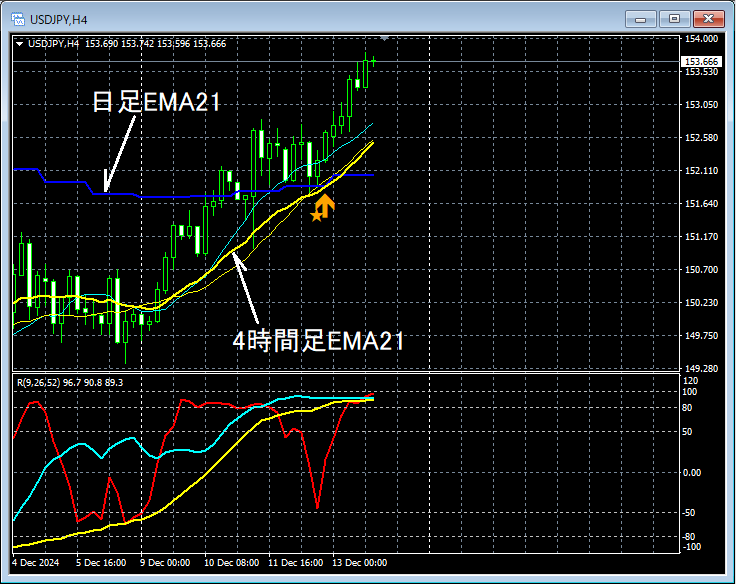
In the 4-hour chart above,Daily EMA21and4-hour EMA21overlap near the bottom,mBDSR (Moving Average filter) buy-on-dip signallights up, and price thereafter climbs firmly.
From this example,a trading method focused on moving averagesandthe signals of mBDSRshowing high compatibility.
Note: In the charts introduced in this article, for ease of explanation, circles, lines, and rectangles may be drawn.
Indicator that shines when combined with RCI【BODSOR・mBDSR】
and methods & case studies (PDF) ★GogoJungle AWARD2020 winner★
https://www.gogojungle.co.jp/tools/indicators/11836
The PDF file contains 358 items (over 1,400 pages, over 470,000 characters).
Most of them areexamples that logically link higher and lower timeframes by using the three RCI lines, sequentially considering the status of multiple lower timeframes, and ultimately waiting for dip-buying or pullback selling timing (i.e., mBDSR signals) on the lower timeframes..
Also,many focus on capturing points where multiple entry reasons overlap..
Additionally,it includes methods to explore ascent targets and decline targets using the RCI three-line strategy..
In the PDF explanations,over 1,350 chartsare used.

Indicator【BODSOR・mBDSR】 that shines when used with RCI
and methods & case studies (PDF) ★GogoJungle AWARD2020 winner★
https://www.gogojungle.co.jp/tools/indicators/11836
mBDSR (RCI filter)andmBDSR (Moving Average filter)serve different roles. The differences in usage are also discussed in the above PDF.
Below,mBDSR (Moving Average filter)sign examples will be introduced.
USD/JPY 4-hour chart
In the 4-hour chart above,Daily EMA21and4-hour EMA21overlap near the bottom,mBDSR (Moving Average filter) buy-on-dip signallights up, and price thereafter climbs firmly.
From this example,a trading method focused on moving averagesandthe signals of mBDSRshowing high compatibility.
Note: In the charts introduced in this article, for ease of explanation, circles, lines, and rectangles may be drawn.
Indicator that shines when combined with RCI【BODSOR・mBDSR】
and methods & case studies (PDF) ★GogoJungle AWARD2020 winner★
https://www.gogojungle.co.jp/tools/indicators/11836
The PDF file contains 358 items (over 1,400 pages, over 470,000 characters).
Most of them areexamples that logically link higher and lower timeframes by using the three RCI lines, sequentially considering the status of multiple lower timeframes, and ultimately waiting for dip-buying or pullback selling timing (i.e., mBDSR signals) on the lower timeframes..
Also,many focus on capturing points where multiple entry reasons overlap..
Additionally,it includes methods to explore ascent targets and decline targets using the RCI three-line strategy..
In the PDF explanations,over 1,350 chartsare used.
× ![]()


