

Master RCI!! Signals for Selling on the Retracement at the Previous High, Double Top, and mBDSR on the Higher Timeframe (2)
【Mastering RCI!! Trend Reversal, Buy the Dips, Sell the Rallies】
Indicator【BODSOR・mBDSR】that shines when combined with RCI
and method - Case studies (PDF) ★GogoJungle AWARD2020 Winner★
https://www.gogojungle.co.jp/tools/indicators/11836
Canadian Dollar/Japanese Yen CADCHF 15-minute chart
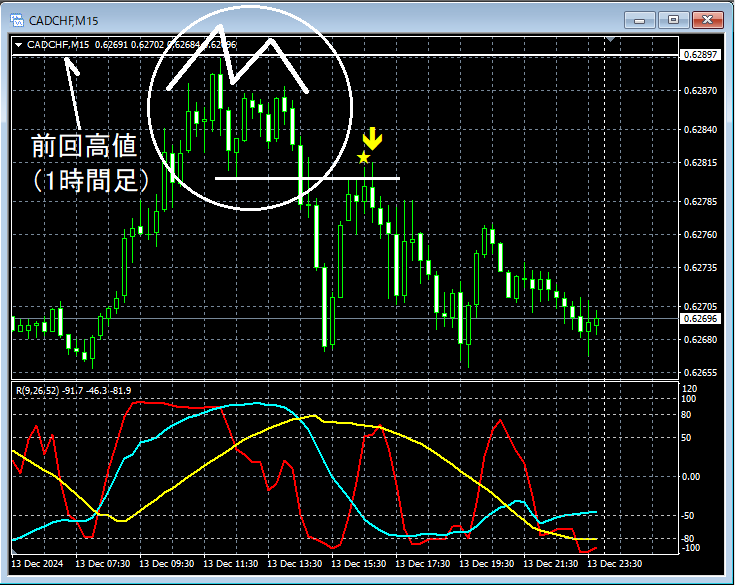
Looking at the 15-minute chart above,it rose toward the previous high on the 1-hour timeframenearby,formed a double topand reversed. After that,the neckline of the double toprose toward,the mBDSR (two RCI lines filter) short-sell signalturned on, and the price moved lower.
Here, we will look more closely at the area encircled in white on the lower time frame (5-minute chart).
Canadian Dollar/Japanese Yen CADCHF 5-minute chart
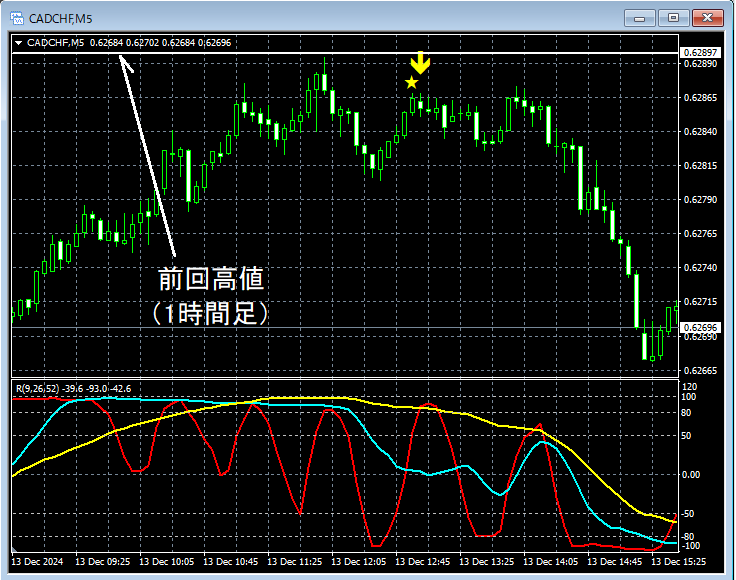
Looking at the 5-minute chart above,it rose toward the previous high on the 1-hour timeframeand then seemed to reverse. In the subsequent rise,the mBDSR (two-RCI lines filter) short-sell signalturned on, and the price has been decreasing.
Additionally, in this example, by placing the stop-loss slightly abovethe recent highand other adjustments,a high risk-reward tradecan be achieved.
From this example,the compatibility between trades focusing on previous highs/double tops on higher timeframesandthe signals from mBDSRis evident.
※Note: In the charts illustrated in this article, for convenience, circles, lines, and rectangles may be drawn.
Indicator【BODSOR・mBDSR】that shines when combined with RCI
and method - Case studies (PDF) ★GogoJungle AWARD2020 Winner★
https://www.gogojungle.co.jp/tools/indicators/11836
The PDF file includes 358 items (over 1,400 pages, over 470,000 characters).
Most of them areexamples that, using three RCI lines to logically link higher and lower timeframes, sequentially examine multiple lower timeframes and ultimately wait for a dip-buy or a rally-sell timing (i.e., mBDSR signals) on the lower timeframes.
Additionally,many focus on identifying points where multiple entry reasons overlap..
Furthermore,it also includes methods for exploring upward and downward targets using the three-RCI-line approach..
In the PDF explanations,more than 1,350 chartsare used.

Indicator【BODSOR・mBDSR】that shines when combined with RCI
and method - Case studies (PDF) ★GogoJungle AWARD2020 Winner★
https://www.gogojungle.co.jp/tools/indicators/11836
Canadian Dollar/Japanese Yen CADCHF 15-minute chart
Looking at the 15-minute chart above,it rose toward the previous high on the 1-hour timeframenearby,formed a double topand reversed. After that,the neckline of the double toprose toward,the mBDSR (two RCI lines filter) short-sell signalturned on, and the price moved lower.
Here, we will look more closely at the area encircled in white on the lower time frame (5-minute chart).
Canadian Dollar/Japanese Yen CADCHF 5-minute chart
Looking at the 5-minute chart above,it rose toward the previous high on the 1-hour timeframeand then seemed to reverse. In the subsequent rise,the mBDSR (two-RCI lines filter) short-sell signalturned on, and the price has been decreasing.
Additionally, in this example, by placing the stop-loss slightly abovethe recent highand other adjustments,a high risk-reward tradecan be achieved.
From this example,the compatibility between trades focusing on previous highs/double tops on higher timeframesandthe signals from mBDSRis evident.
※Note: In the charts illustrated in this article, for convenience, circles, lines, and rectangles may be drawn.
Indicator【BODSOR・mBDSR】that shines when combined with RCI
and method - Case studies (PDF) ★GogoJungle AWARD2020 Winner★
https://www.gogojungle.co.jp/tools/indicators/11836
The PDF file includes 358 items (over 1,400 pages, over 470,000 characters).
Most of them areexamples that, using three RCI lines to logically link higher and lower timeframes, sequentially examine multiple lower timeframes and ultimately wait for a dip-buy or a rally-sell timing (i.e., mBDSR signals) on the lower timeframes.
Additionally,many focus on identifying points where multiple entry reasons overlap..
Furthermore,it also includes methods for exploring upward and downward targets using the three-RCI-line approach..
In the PDF explanations,more than 1,350 chartsare used.
× ![]()


