

[RCI Research] The downtrend formed by the lower time frame's double top on the right side of the upper time frame's double top, and the mBDSR pullback sell signal
【Mastering RCI!! Trend Reversals, Buy on Dips, Sell on Rallies】
Indicator 【BODSOR・mBDSR】 that shines in combination with RCI
Methods, and Case Studies (PDF) ★GogoJungle AWARD2020 Winner★
https://www.gogojungle.co.jp/tools/indicators/11836
AUDCHF (Aussie Swiss) 4-hour
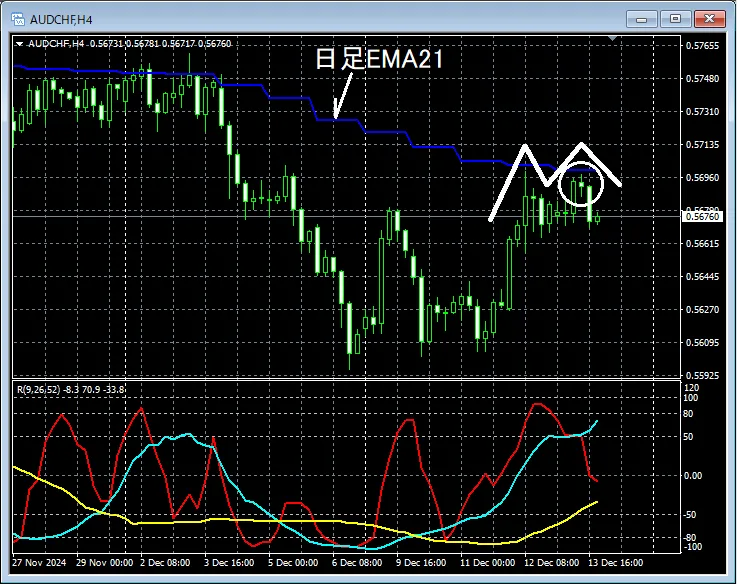
On the upper 4-hour chart, the important moving averageDaily EMA21is rising.Daily EMA21It might not be unusual to look for selling rallies near this level.
Here, on the 4-hour chart,Double Topmay form, so we will check the area circled in white in more detail on a lower timeframe.
AUDCHF (Aussie Swiss) 5-minute
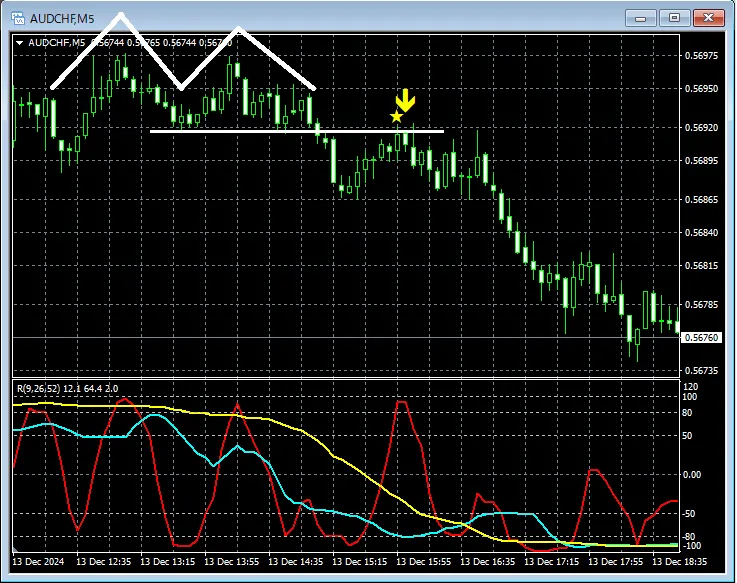
Watching the 5-minute chart above, at the area where the right peak of the Double Top on the 4-hour chart may formDouble Topon the 5-minute chart is forming. AfterwardDouble Top Necklineapproaches,mBDSR (RCI two-filter) Sell signallights up and the price declines.
From this example,a trading method focused on moving averages and Double Topsandthe signal from mBDSRshow high compatibility.
Note: In this article, for convenience in explanations, charts may have added circles, lines, and rectangles.
Indicator that shines in combination with RCI 【BODSOR・mBDSR】
Methods and Case Studies (PDF) ★GogoJungle AWARD2020 Winner★
https://www.gogojungle.co.jp/tools/indicators/11836
The PDF file includes 358 items (over 1,400 pages, over 470,000 characters in total).
Most of theseare cases where the higher and lower timeframes are logically linked using the RCI three-line setup, and the analysis progresses by considering multiple lower timeframes, ultimately waiting for a dip-buy or pullback timing (i.e., mBDSR signals) on the lower timeframesas described.
Additionally,there is emphasis on identifying points where multiple entry rationale overlapsas well.
Furthermore,the method using the RCI three-line setup to explore upward and downward targetsis included.
In the PDF explanations,more than 1,350 chartsare used.

Indicator 【BODSOR・mBDSR】 that shines in combination with RCI
Methods, and Case Studies (PDF) ★GogoJungle AWARD2020 Winner★
https://www.gogojungle.co.jp/tools/indicators/11836
AUDCHF (Aussie Swiss) 4-hour
On the upper 4-hour chart, the important moving averageDaily EMA21is rising.Daily EMA21It might not be unusual to look for selling rallies near this level.
Here, on the 4-hour chart,Double Topmay form, so we will check the area circled in white in more detail on a lower timeframe.
AUDCHF (Aussie Swiss) 5-minute
Watching the 5-minute chart above, at the area where the right peak of the Double Top on the 4-hour chart may formDouble Topon the 5-minute chart is forming. AfterwardDouble Top Necklineapproaches,mBDSR (RCI two-filter) Sell signallights up and the price declines.
From this example,a trading method focused on moving averages and Double Topsandthe signal from mBDSRshow high compatibility.
Note: In this article, for convenience in explanations, charts may have added circles, lines, and rectangles.
Indicator that shines in combination with RCI 【BODSOR・mBDSR】
Methods and Case Studies (PDF) ★GogoJungle AWARD2020 Winner★
https://www.gogojungle.co.jp/tools/indicators/11836
The PDF file includes 358 items (over 1,400 pages, over 470,000 characters in total).
Most of theseare cases where the higher and lower timeframes are logically linked using the RCI three-line setup, and the analysis progresses by considering multiple lower timeframes, ultimately waiting for a dip-buy or pullback timing (i.e., mBDSR signals) on the lower timeframesas described.
Additionally,there is emphasis on identifying points where multiple entry rationale overlapsas well.
Furthermore,the method using the RCI three-line setup to explore upward and downward targetsis included.
In the PDF explanations,more than 1,350 chartsare used.
× ![]()


