

Master RCI!! - In higher timeframes, previous high, double top, and mbDSR pullback sell signal (1)
0
【Mastering RCI!! Trend Reversal, Buy on Dips, Sell on Rallies】
Indicator【BODSOR・mBDSR】that shines when combined with RCI
and methods・case studies (PDF) ★GogoJungle AWARD2020 Winner★
https://www.gogojungle.co.jp/tools/indicators/11836
Nikkei 225 JP225 30-minute Chart
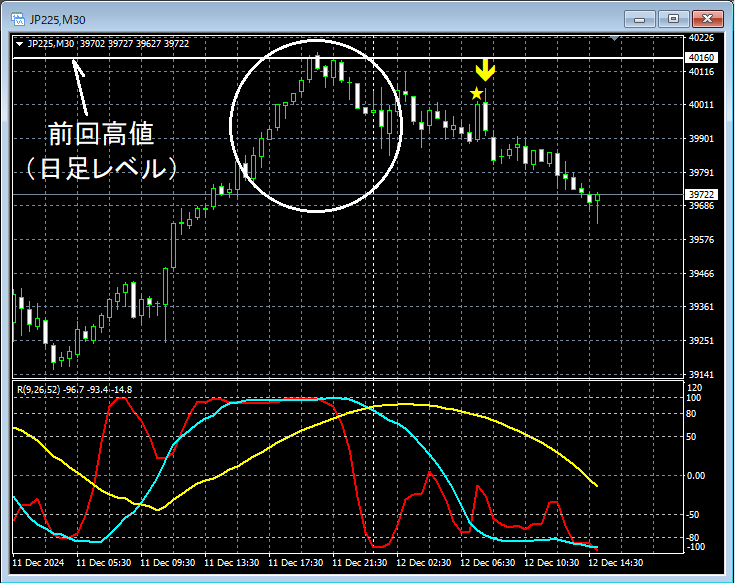
Looking at the 30-minute chart above,it rose toward the previous high on the daily chartand then pulled back. In the subsequent rise,the back‑test signal of mBDSR (two RCI lines filter)lit up, and price continued to fall.
Here we will look in more detail at the area circled in white on a lower time frame (5-minute).
Nikkei 225 JP225 5-minute Chart
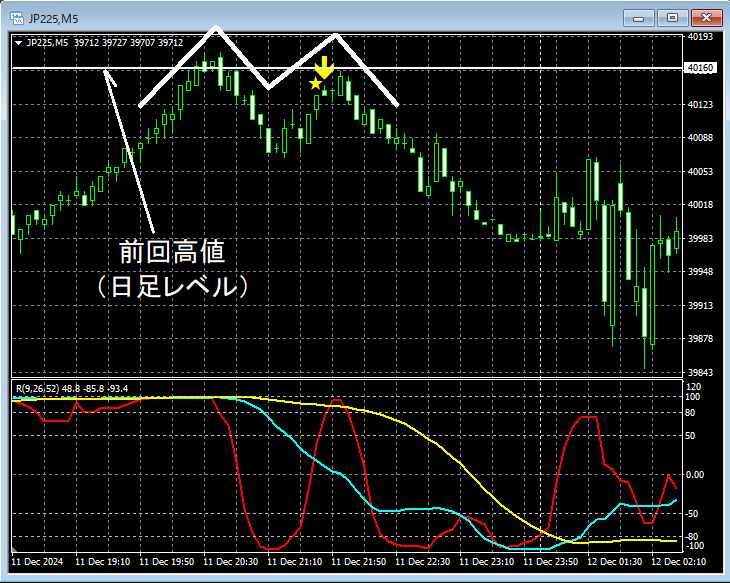
Looking at the 5-minute chart above,it rose toward the previous high on the daily chartand then began to reverse. In the subsequent rise,the back‑test signal of mBDSR (two RCI lines filter)turned on, and prices steadily moved downward. As a result,a right-hand peak of a double topappears to have triggered the signal.
Also, in this example, by placing the stop loss slightly above therecent highand other adjustments,a high risk‑reward tradeis possible.
From this example,the high compatibility between trading methods that focus on the previous high and double tops on higher time frames andthe signals frommBDSRis evident.
※Please note that the charts shown in this article may include added circles, lines, rectangles, etc. for clarity.
Indicator【BODSOR・mBDSR】that shines when combined with RCI
and methods・case studies (PDF) ★GogoJungle AWARD2020 Winner★
https://www.gogojungle.co.jp/tools/indicators/11836
The PDF file contains 358 items (over 1,400 pages, over 470,000 characters).
Most of themdocument how to logically link higher and lower time frames using the three RCI lines, progressively examining multiple lower time frames, and ultimately waiting for a dip buying or rally selling timing (i.e., mBDSR signals) on the lower time frame.
Also,many focus on identifying points where multiple entry criteria align..
Additionally,there are methods to explore upward and downward targets using the three RCI lines..
In the explanations within the PDF files,more than 1,350 chartsare used.

Indicator【BODSOR・mBDSR】that shines when combined with RCI
and methods・case studies (PDF) ★GogoJungle AWARD2020 Winner★
https://www.gogojungle.co.jp/tools/indicators/11836
Nikkei 225 JP225 30-minute Chart
Looking at the 30-minute chart above,it rose toward the previous high on the daily chartand then pulled back. In the subsequent rise,the back‑test signal of mBDSR (two RCI lines filter)lit up, and price continued to fall.
Here we will look in more detail at the area circled in white on a lower time frame (5-minute).
Nikkei 225 JP225 5-minute Chart
Looking at the 5-minute chart above,it rose toward the previous high on the daily chartand then began to reverse. In the subsequent rise,the back‑test signal of mBDSR (two RCI lines filter)turned on, and prices steadily moved downward. As a result,a right-hand peak of a double topappears to have triggered the signal.
Also, in this example, by placing the stop loss slightly above therecent highand other adjustments,a high risk‑reward tradeis possible.
From this example,the high compatibility between trading methods that focus on the previous high and double tops on higher time frames andthe signals frommBDSRis evident.
※Please note that the charts shown in this article may include added circles, lines, rectangles, etc. for clarity.
Indicator【BODSOR・mBDSR】that shines when combined with RCI
and methods・case studies (PDF) ★GogoJungle AWARD2020 Winner★
https://www.gogojungle.co.jp/tools/indicators/11836
The PDF file contains 358 items (over 1,400 pages, over 470,000 characters).
Most of themdocument how to logically link higher and lower time frames using the three RCI lines, progressively examining multiple lower time frames, and ultimately waiting for a dip buying or rally selling timing (i.e., mBDSR signals) on the lower time frame.
Also,many focus on identifying points where multiple entry criteria align..
Additionally,there are methods to explore upward and downward targets using the three RCI lines..
In the explanations within the PDF files,more than 1,350 chartsare used.
× ![]()


