

English translation (preserving HTML format): [Mastering RCI!!] Three tops (Head and Shoulders) and a return-sell signal of mBDSR
0
【Mastering RCI!! Trend Reversal, Buy on Dips, Sell on Rallies】
Indicator【BODSOR・mBDSR】that shines when used in combination with RCI
Methods, and case studies (PDF) ★GogoJungle AWARD2020 Winner★
https://www.gogojungle.co.jp/tools/indicators/11836
AUD/USD, AUDJPY, 5-minute chart
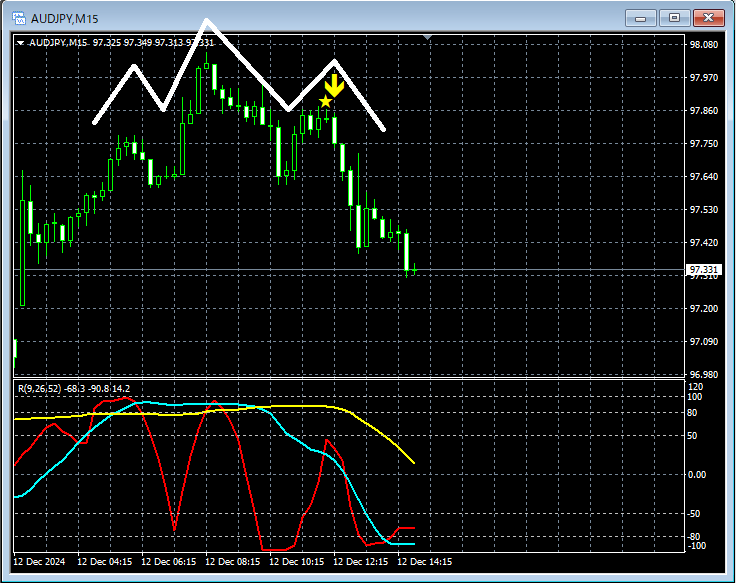
On the upper 5-minute chart,mBDSR (RCI two-line filter)sell-off signals are lit, and afterward, price has been declining smoothly. As a result,Head and Shoulders's right shouldermBDSR (RCI two-line filter)signals lit and it has been moving lower.
From this example,a trading approach focused on the Head and Shoulders patternandthe signals of mBDSRshow strong harmony.
Note: In the charts presented in this article, for convenience of explanation, circles, lines, and rectangles may be drawn.
Indicator【BODSOR・mBDSR】that shines when used in combination with RCI
Methods, and case studies (PDF) ★GogoJungle AWARD2020 Winner★
https://www.gogojungle.co.jp/tools/indicators/11836
The PDF file includes 358 items (over 1,400 pages, over 470,000 characters in total).
Most of them areexamples that logically link higher and lower timeframes using three RCI lines, systematically examining the situation across multiple lower timeframes and ultimately waiting for buy on dips or sell on rallies timing (i.e., mBDSR signals) on the lower timeframes.
Additionally,many focus on identifying points where multiple entry reasons coincide..
Moreover,there are techniques for exploring upside or downside targets using three RCI lines as well..
In the PDF explanations,over 1,350 chartsare used.

Indicator【BODSOR・mBDSR】that shines when used in combination with RCI
Methods, and case studies (PDF) ★GogoJungle AWARD2020 Winner★
https://www.gogojungle.co.jp/tools/indicators/11836
AUD/USD, AUDJPY, 5-minute chart
On the upper 5-minute chart,mBDSR (RCI two-line filter)sell-off signals are lit, and afterward, price has been declining smoothly. As a result,Head and Shoulders's right shouldermBDSR (RCI two-line filter)signals lit and it has been moving lower.
From this example,a trading approach focused on the Head and Shoulders patternandthe signals of mBDSRshow strong harmony.
Note: In the charts presented in this article, for convenience of explanation, circles, lines, and rectangles may be drawn.
Indicator【BODSOR・mBDSR】that shines when used in combination with RCI
Methods, and case studies (PDF) ★GogoJungle AWARD2020 Winner★
https://www.gogojungle.co.jp/tools/indicators/11836
The PDF file includes 358 items (over 1,400 pages, over 470,000 characters in total).
Most of them areexamples that logically link higher and lower timeframes using three RCI lines, systematically examining the situation across multiple lower timeframes and ultimately waiting for buy on dips or sell on rallies timing (i.e., mBDSR signals) on the lower timeframes.
Additionally,many focus on identifying points where multiple entry reasons coincide..
Moreover,there are techniques for exploring upside or downside targets using three RCI lines as well..
In the PDF explanations,over 1,350 chartsare used.
× ![]()


