

Master RCI!! Third low attempt, double bottom, and mBDSR pullback buy signal
0
【Mastering RCI!! Trend Reversal, Buy the Dip, Sell the Rally】
Indicator that shines when used with RCI: 【BODSOR・mBDSR】
Methods and Case Studies (PDF) ★GogoJungle AWARD2020 Winner★
https://www.gogojungle.co.jp/tools/indicators/11836
Australia Swiss AUDCHF Daily
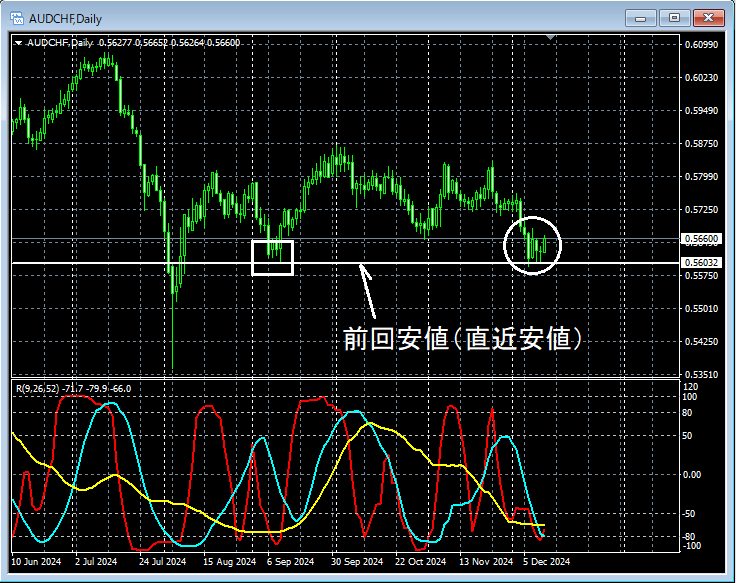
Around the area circled in white on the daily chart,previous low (recent low)has been reached / approached. Decide whether to clearly break this line or to rebound, and examine it in more detail on lower timeframes.
Australia Swiss AUDCHF 4-hour
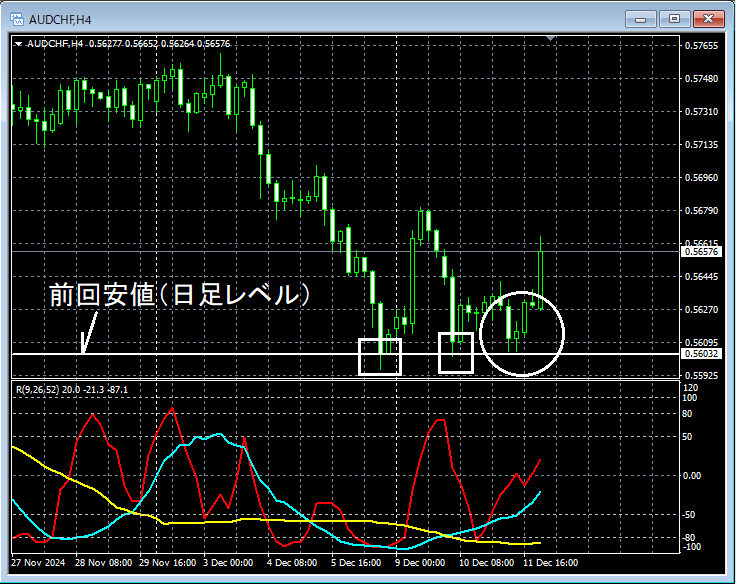
Around the area circled in white on the 4-hour chart,previous low (daily level)relative to,third attempt at a lowis forming.Third low attemptsupport line, a larger rise is possible. First, it may not be unusual to look for dip-buying until thesupport lineis clearly breached. On even lower timeframes, cautiously look for signs of a rebound first.
Australia Swiss AUDCHF 5-minute
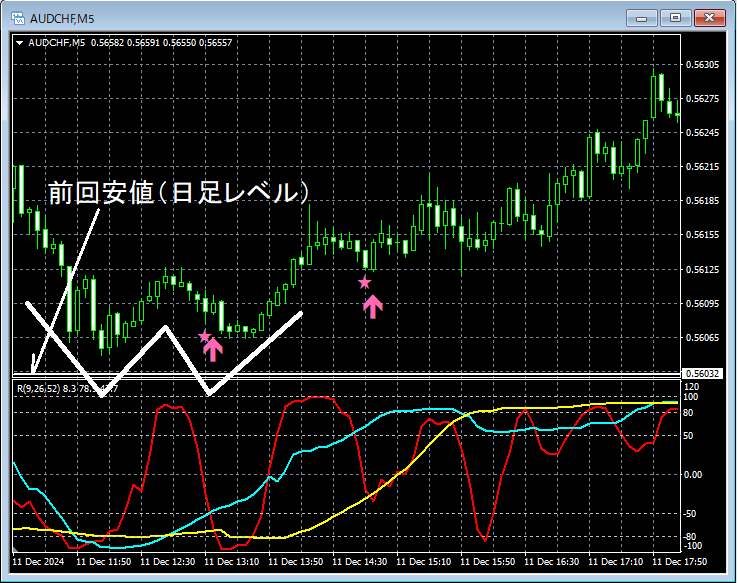
On the 5-minute chart above,the support lineis being rejected near.Double bottomon the right-hand valleymBDSR (RCI two-line filter) dip-buy signallights up. Subsequently, price has been rising smoothly. Even during the ascent, anothermBDSR (RCI two-line filter) dip-buy signallights up.
From this example,a trading approach focused on the previous low (recent low), the third low attempt, and the double bottomandthe signals from mBDSRshow strong compatibility.
Also, in this example, by placing the stop-loss slightly below the recent low (the left valley of the double bottom),a high risk-reward tradeis achievable.
※Please note that charts introduced in this article may have added circles, lines, or boxes for explanation purposes.
Indicator that shines when used with RCI: 【BODSOR・mBDSR】
Methods and Case Studies (PDF) ★GogoJungle AWARD2020 Winner★
https://www.gogojungle.co.jp/tools/indicators/11836
The PDF file contains 358 items (over 1,400 pages, over 470,000 characters).
Many of these are summaries of the approach where RCI three-line setup logically links higher and lower timeframes, systematically considering multiple lower timeframes and ultimately waiting for the dip-buy or the pullback timing (i.e., mBDSR signals) on the lower timeframes.
Additionally,many focus on identifying points where multiple entry reasons coincide..
Note also thatthe method for exploring upward and downward targets using the RCI three-line setup is included..
In the PDF material,more than 1,350 chartsare used.

Indicator that shines when used with RCI: 【BODSOR・mBDSR】
Methods and Case Studies (PDF) ★GogoJungle AWARD2020 Winner★
https://www.gogojungle.co.jp/tools/indicators/11836
Australia Swiss AUDCHF Daily
Around the area circled in white on the daily chart,previous low (recent low)has been reached / approached. Decide whether to clearly break this line or to rebound, and examine it in more detail on lower timeframes.
Australia Swiss AUDCHF 4-hour
Around the area circled in white on the 4-hour chart,previous low (daily level)relative to,third attempt at a lowis forming.Third low attemptsupport line, a larger rise is possible. First, it may not be unusual to look for dip-buying until thesupport lineis clearly breached. On even lower timeframes, cautiously look for signs of a rebound first.
Australia Swiss AUDCHF 5-minute
On the 5-minute chart above,the support lineis being rejected near.Double bottomon the right-hand valleymBDSR (RCI two-line filter) dip-buy signallights up. Subsequently, price has been rising smoothly. Even during the ascent, anothermBDSR (RCI two-line filter) dip-buy signallights up.
From this example,a trading approach focused on the previous low (recent low), the third low attempt, and the double bottomandthe signals from mBDSRshow strong compatibility.
Also, in this example, by placing the stop-loss slightly below the recent low (the left valley of the double bottom),a high risk-reward tradeis achievable.
※Please note that charts introduced in this article may have added circles, lines, or boxes for explanation purposes.
Indicator that shines when used with RCI: 【BODSOR・mBDSR】
Methods and Case Studies (PDF) ★GogoJungle AWARD2020 Winner★
https://www.gogojungle.co.jp/tools/indicators/11836
The PDF file contains 358 items (over 1,400 pages, over 470,000 characters).
Many of these are summaries of the approach where RCI three-line setup logically links higher and lower timeframes, systematically considering multiple lower timeframes and ultimately waiting for the dip-buy or the pullback timing (i.e., mBDSR signals) on the lower timeframes.
Additionally,many focus on identifying points where multiple entry reasons coincide..
Note also thatthe method for exploring upward and downward targets using the RCI three-line setup is included..
In the PDF material,more than 1,350 chartsare used.
× ![]()


