

[Master RCI!! Gold Research] Noticeable high price and mBDSR (MA2 single-filter) pullback buying signal
0
【Mastering RCI!! Trend Reversal, Buy on Dip, Sell on Rallies】
An indicator that shines when used in combination with RCI【BODSOR・mBDSR】
and its methods and case studies (PDF) ★GogoJungle AWARD2020 Winner★
https://www.gogojungle.co.jp/tools/indicators/11836
mBDSR (RCI Filter)andmBDSR (Moving Average Filter)have different roles. The PDF above also touches on how to use them appropriately.
Below, we introducethe signal examples for mBDSR (Moving Average Filter)
Gold XAUUSD 1-hour chart
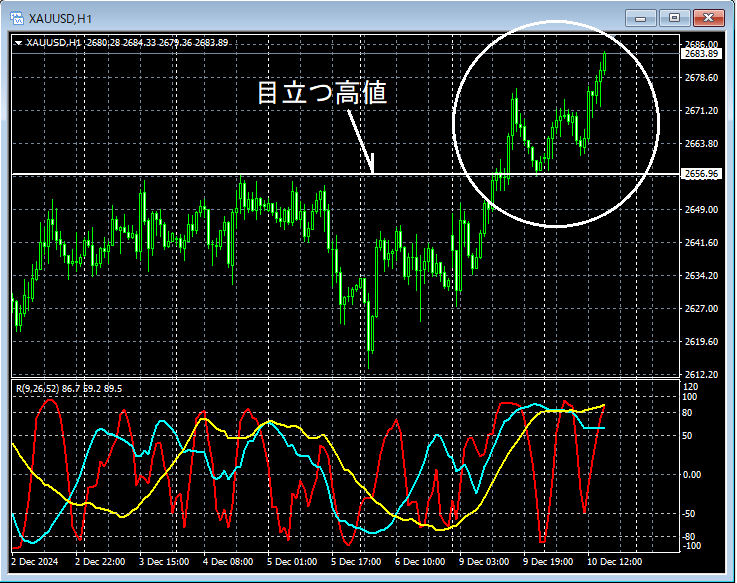
If you look around the area circled by the white circle on the hourly chart above, it often serves as a supportnotable highto which the price has fallen. It might not be strange to consider a slight rise. Let’s take a closer look at the same hourly chart.
Gold XAUUSD 1-hour chart
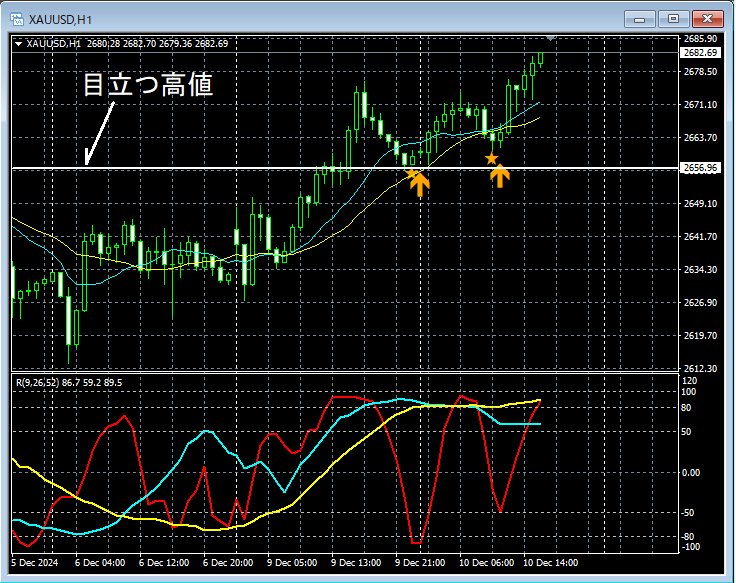
On the above hourly chart, it often functions as supportnotable highnearby,the buy-the-dip signal of the two-method mBDSR (Two Moving Averages Filter)the buy-the-dip signal of the two-method mBDSRlights up and the price climbs further.
From this example,there is a strong synergy between a trading approach focused on notable highsandthe signals of mBDSRthat can be observed.
※Please note that in the charts introduced in this article, circles, straight lines, and rectangles may be drawn for convenience of explanation.
An indicator that shines in combination with RCI【BODSOR・mBDSR】
and its methods and case studies (PDF) ★GogoJungle AWARD2020 Winner★
https://www.gogojungle.co.jp/tools/indicators/11836
The PDF file includes 358 items (over 1,400 pages, over 470,000 characters).
Many of these are summaries of cases where multiple lower-timeframe conditions are considered by logically linking higher and lower timeframes using the three RCI lines, eventually waiting for a dip buy or a pullback sell timing (i.e., mBDSR signals) on the lower timeframe.
Additionally,many of them emphasize capturing points where multiple entry reasons overlap..
Also included is a method to explore upside and downside targets using the RCI three-line method.
In the PDF's explanations,more than 1,350 chartsare used.

An indicator that shines when used in combination with RCI【BODSOR・mBDSR】
and its methods and case studies (PDF) ★GogoJungle AWARD2020 Winner★
https://www.gogojungle.co.jp/tools/indicators/11836
mBDSR (RCI Filter)andmBDSR (Moving Average Filter)have different roles. The PDF above also touches on how to use them appropriately.
Below, we introducethe signal examples for mBDSR (Moving Average Filter)
Gold XAUUSD 1-hour chart
If you look around the area circled by the white circle on the hourly chart above, it often serves as a supportnotable highto which the price has fallen. It might not be strange to consider a slight rise. Let’s take a closer look at the same hourly chart.
Gold XAUUSD 1-hour chart
On the above hourly chart, it often functions as supportnotable highnearby,the buy-the-dip signal of the two-method mBDSR (Two Moving Averages Filter)the buy-the-dip signal of the two-method mBDSRlights up and the price climbs further.
From this example,there is a strong synergy between a trading approach focused on notable highsandthe signals of mBDSRthat can be observed.
※Please note that in the charts introduced in this article, circles, straight lines, and rectangles may be drawn for convenience of explanation.
An indicator that shines in combination with RCI【BODSOR・mBDSR】
and its methods and case studies (PDF) ★GogoJungle AWARD2020 Winner★
https://www.gogojungle.co.jp/tools/indicators/11836
The PDF file includes 358 items (over 1,400 pages, over 470,000 characters).
Many of these are summaries of cases where multiple lower-timeframe conditions are considered by logically linking higher and lower timeframes using the three RCI lines, eventually waiting for a dip buy or a pullback sell timing (i.e., mBDSR signals) on the lower timeframe.
Additionally,many of them emphasize capturing points where multiple entry reasons overlap..
Also included is a method to explore upside and downside targets using the RCI three-line method.
In the PDF's explanations,more than 1,350 chartsare used.
× ![]()


