

[Master RCI!! From the most recent USD/JPY chart] mBDSR’s return-sell signal
0
【Mastering RCI!! Trend Reversals, Buy on Dips, Sell on Rallies】
Indicator that shines when combined with RCI: 【BODSOR・mBDSR】
Methods, and Case Studies (PDF) ★GogoJungle AWARD2020 winner★
https://www.gogojungle.co.jp/tools/indicators/11836
USDJPY 15-minute chart
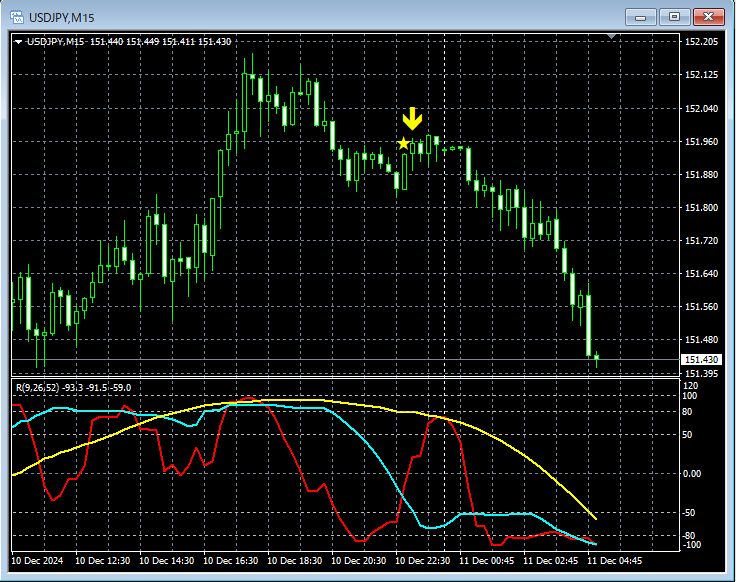
The status of the higher timeframe is omitted,as in the accompanying PDF, common patternsare shown. In this case,RCI three-lineis used to drill down from higher timeframes to lower timeframes (in this example, the 15-minute chart)mBDSR signalsuntil they appear, then price declines steadily. On the upper 15-minute chart,mBDSR (RCI two-line filter)sell signals light up, and subsequently price drops smoothly.
In this example, although there is no direct downscaling from higher to lower timeframes,the neck line of the double topretraces to near that levelmBDSR (RCI two-line filter)signals light up and price declines.
From this example,a trading method focusing on the neck line of a double topandthe signal of mBDSRshow high compatibility.
※Please note that some charts shown in this article may have added circles, straight lines, or squares for explanatory convenience.
Indicator that shines when combined with RCI: 【BODSOR・mBDSR】
Methods, and Case Studies (PDF) ★GogoJungle AWARD2020 winner★
https://www.gogojungle.co.jp/tools/indicators/11836
The PDF file contains 358 documents (over 1,400 pages, over 470,000 characters in total).
Many of them areexamples that logically link higher and lower timeframes using three-line RCI, analyzing multiple lower-timeframe conditions step by step, ultimately waiting for the dips (buy signals) or rallies (sell signals) on the lower timeframe via mBDSR..
Additionally,there are many pieces that emphasize pinpointing points where multiple entry reasons coincide..
Also included is a method for exploring upward and downward targets using the three-line RCI.
In the PDF explanations,more than 1,350 chartsare used.

Indicator that shines when combined with RCI: 【BODSOR・mBDSR】
Methods, and Case Studies (PDF) ★GogoJungle AWARD2020 winner★
https://www.gogojungle.co.jp/tools/indicators/11836
USDJPY 15-minute chart
The status of the higher timeframe is omitted,as in the accompanying PDF, common patternsare shown. In this case,RCI three-lineis used to drill down from higher timeframes to lower timeframes (in this example, the 15-minute chart)mBDSR signalsuntil they appear, then price declines steadily. On the upper 15-minute chart,mBDSR (RCI two-line filter)sell signals light up, and subsequently price drops smoothly.
In this example, although there is no direct downscaling from higher to lower timeframes,the neck line of the double topretraces to near that levelmBDSR (RCI two-line filter)signals light up and price declines.
From this example,a trading method focusing on the neck line of a double topandthe signal of mBDSRshow high compatibility.
※Please note that some charts shown in this article may have added circles, straight lines, or squares for explanatory convenience.
Indicator that shines when combined with RCI: 【BODSOR・mBDSR】
Methods, and Case Studies (PDF) ★GogoJungle AWARD2020 winner★
https://www.gogojungle.co.jp/tools/indicators/11836
The PDF file contains 358 documents (over 1,400 pages, over 470,000 characters in total).
Many of them areexamples that logically link higher and lower timeframes using three-line RCI, analyzing multiple lower-timeframe conditions step by step, ultimately waiting for the dips (buy signals) or rallies (sell signals) on the lower timeframe via mBDSR..
Additionally,there are many pieces that emphasize pinpointing points where multiple entry reasons coincide..
Also included is a method for exploring upward and downward targets using the three-line RCI.
In the PDF explanations,more than 1,350 chartsare used.
× ![]()


