

【Today 2024/12/10 Euro/AUD】Upper timeframe retracement high and notable high, and lower timeframe mBDSR (RCI with 2 lines filter) pullback buy signal
0
An indicator that shows power when combined with RCI: BODSOR・mBDSR
and methods / case studies (PDF) ★GogoJungle AWARD2020 winner★
https://www.gogojungle.co.jp/tools/indicators/11836
EUR/AUD 4-hour chart

Looking at the area circled with a white circle on the 4-hour chart above,the price has broken above a retracement high (prominent high)and has pulled back toward around that prominent high.It might be a scene where a slight rebound is not unexpected. We will check for signs of bounce on lower time frames.
EUR/AUD 15-minute chart
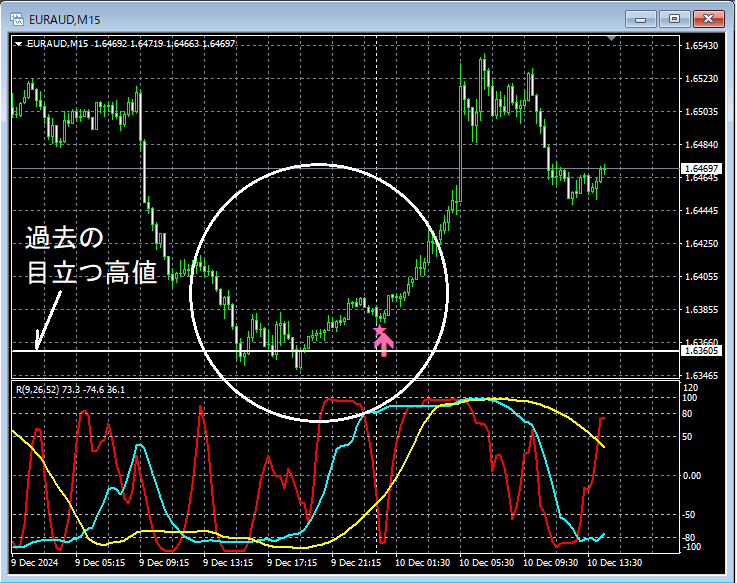
On the 15-minute chart above,after falling to around the previous prominent high on the higher time frame, it rebounded. mBDSR (RCI two-line filter) buy-the-dip signallights up, and price rises solidly.
From this example,the harmony between a trading method that focuses on past prominent highsandthe signals of mBDSRis evident.
※Please note that in the charts shown in this article, for convenience of explanation, circles, lines, and boxes may have been added.
An indicator that shines when combined with RCI: BODSOR・mBDSR
and methods / case studies (PDF) ★GogoJungle AWARD2020 winner★
https://www.gogojungle.co.jp/tools/indicators/11836
The PDF file includes 358 items (over 1,400 pages, over 470,000 characters in total).
Most of them are summaries of examples that lay out a structure where multiple lower-timeframe conditions are considered sequentially by using three RCI lines to logically link higher and lower timeframes, and finally wait for a pullback buying or pullback selling timing (i.e., mBDSR signals) on the lower timeframes.
Additionally,many of them emphasize capturing points where several entry reasons coincide.
Note also thatthere are methods that explore upward and downward targets using three RCI lines.
In the description within the PDF file,more than 1,350 chartsare used.

and methods / case studies (PDF) ★GogoJungle AWARD2020 winner★
https://www.gogojungle.co.jp/tools/indicators/11836
EUR/AUD 4-hour chart
Looking at the area circled with a white circle on the 4-hour chart above,the price has broken above a retracement high (prominent high)and has pulled back toward around that prominent high.It might be a scene where a slight rebound is not unexpected. We will check for signs of bounce on lower time frames.
EUR/AUD 15-minute chart
On the 15-minute chart above,after falling to around the previous prominent high on the higher time frame, it rebounded. mBDSR (RCI two-line filter) buy-the-dip signallights up, and price rises solidly.
From this example,the harmony between a trading method that focuses on past prominent highsandthe signals of mBDSRis evident.
※Please note that in the charts shown in this article, for convenience of explanation, circles, lines, and boxes may have been added.
An indicator that shines when combined with RCI: BODSOR・mBDSR
and methods / case studies (PDF) ★GogoJungle AWARD2020 winner★
https://www.gogojungle.co.jp/tools/indicators/11836
The PDF file includes 358 items (over 1,400 pages, over 470,000 characters in total).
Most of them are summaries of examples that lay out a structure where multiple lower-timeframe conditions are considered sequentially by using three RCI lines to logically link higher and lower timeframes, and finally wait for a pullback buying or pullback selling timing (i.e., mBDSR signals) on the lower timeframes.
Additionally,many of them emphasize capturing points where several entry reasons coincide.
Note also thatthere are methods that explore upward and downward targets using three RCI lines.
In the description within the PDF file,more than 1,350 chartsare used.
× ![]()


