

[Today 2024.12.09 Pound-Australian] Resistance zone, double top, and mBDSR (RCI 2-filter) retracement sell signal
0
【Mastering RCI!! Trend Reversal, Buy on Dips, Sell on Rallies】
An indicator that shines when combined with RCI【BODSOR・mBDSR】
methods, and case studies (PDF) ★GogoJungle AWARD2020 recipient★
https://www.gogojungle.co.jp/tools/indicators/11836
Pound Aussie GBPAUD 1-hour chart
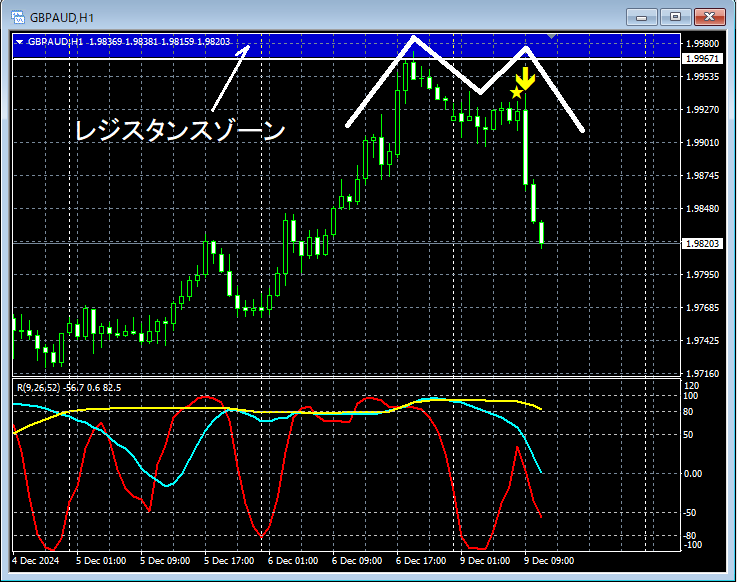
In the 1-hour chart above,Resistance Zonereached and then showed signs of reversal. After that,mBDSR (2 RCIs filter)sell signal lights up, and the price clearly moves lower.
As a result,the timing of the decline on the right-side peak of the double top is captured wellby the setup.
From this example,a trading method that focuses on resistance zones and double topsandthe signals of mBDSRshow a strong synergy.
※Please note that in the charts shown in this article, for convenience of explanation, circles, lines, squares, etc. may have been added.
An indicator that shines when combined with RCI【BODSOR・mBDSR】
methods, and case studies (PDF) ★GogoJungle AWARD2020 recipient★
https://www.gogojungle.co.jp/tools/indicators/11836
The PDF file includes 358 items (over 1,400 pages, over 470,000 characters).
Many of these areexamples that logically link higher time frames with lower time frames using 3 RCIs, and gradually analyze the 状況 of multiple lower time frames, ultimately waiting for buy-the-dip or sell-the-rally timing (i.e., mBDSR signals) on the lower time frame.
Additionally,many focus on capturing points where multiple entry reasons overlap.
Note thatthere are also methods that explore ascent targets and decline targets using the 3-line RCI.
In the explanations within the PDF file,over 1,350 chartsare used.

An indicator that shines when combined with RCI【BODSOR・mBDSR】
methods, and case studies (PDF) ★GogoJungle AWARD2020 recipient★
https://www.gogojungle.co.jp/tools/indicators/11836
Pound Aussie GBPAUD 1-hour chart
In the 1-hour chart above,Resistance Zonereached and then showed signs of reversal. After that,mBDSR (2 RCIs filter)sell signal lights up, and the price clearly moves lower.
As a result,the timing of the decline on the right-side peak of the double top is captured wellby the setup.
From this example,a trading method that focuses on resistance zones and double topsandthe signals of mBDSRshow a strong synergy.
※Please note that in the charts shown in this article, for convenience of explanation, circles, lines, squares, etc. may have been added.
An indicator that shines when combined with RCI【BODSOR・mBDSR】
methods, and case studies (PDF) ★GogoJungle AWARD2020 recipient★
https://www.gogojungle.co.jp/tools/indicators/11836
The PDF file includes 358 items (over 1,400 pages, over 470,000 characters).
Many of these areexamples that logically link higher time frames with lower time frames using 3 RCIs, and gradually analyze the 状況 of multiple lower time frames, ultimately waiting for buy-the-dip or sell-the-rally timing (i.e., mBDSR signals) on the lower time frame.
Additionally,many focus on capturing points where multiple entry reasons overlap.
Note thatthere are also methods that explore ascent targets and decline targets using the 3-line RCI.
In the explanations within the PDF file,over 1,350 chartsare used.
× ![]()


