

【Today 2024/12/06 EURAUD】Sign of dip buying on the last updated high and mBDSR
【Mastering RCI!! Trend Reversal・Buy on Dips・Sell on Rallies】
Indicator【BODSOR・mBDSR】that shines in combination with RCI
Methods・Case Studies (PDF) ★GogoJungle AWARD2020 Winner★
https://www.gogojungle.co.jp/tools/indicators/11836
mBDSR (RCI Filter)andmBDSR (Moving Average Filter)have different roles. The above PDF also discusses how to use these distinctions.
Below,mBDSR (Moving Average Filter)sign examples are introduced.
Euro/Oz EURAUD 1-hour
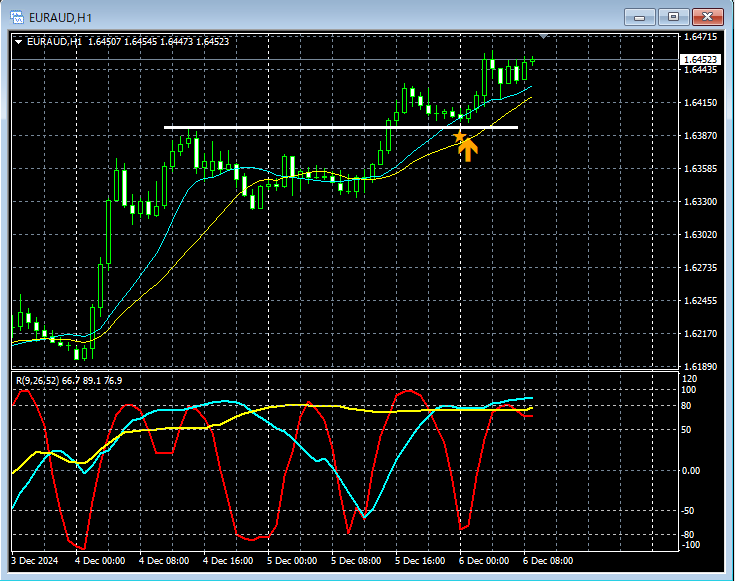
Details of the higher timeframe are omitted.
In the above 1-hour chart,the previous updated highwas approached andthe mBDSR (MA 2-filter) pullback buy signalwas triggered, and prices have risen steadily from right after that.
As repeatedly written in articles up to now,the previous updated highoften functions as a support level.
From this example,a trading method focused on the previous updated highandthe BDSR signalsshow a high degree of compatibility.
※Note: In the charts introduced in this article, for convenience of explanation, circles, lines, and rectangles may be drawn.
Indicator【BODSOR・mBDSR】that shines in combination with RCI
Methods・Case Studies (PDF) ★GogoJungle AWARD2020 Winner★
https://www.gogojungle.co.jp/tools/indicators/11836
The PDF file contains 358 files (over 1,400 pages, over 470,000 characters in total).
Many of them summarize examples that link higher and lower timeframes logically using three RCI lines to consider the state of multiple lower timeframes step by step, and ultimately wait for dips or pullback buy signals on the lower timeframe (i.e., mBDSR signals).
Also,many entries focus on identifying points where multiple entry reasons overlap.
Additionally,it includes methods to explore upside and downside targets using the three RCI lines..
In the PDF explanations,there are over 1,350 charts used..

Indicator【BODSOR・mBDSR】that shines in combination with RCI
Methods・Case Studies (PDF) ★GogoJungle AWARD2020 Winner★
https://www.gogojungle.co.jp/tools/indicators/11836
mBDSR (RCI Filter)andmBDSR (Moving Average Filter)have different roles. The above PDF also discusses how to use these distinctions.
Below,mBDSR (Moving Average Filter)sign examples are introduced.
Euro/Oz EURAUD 1-hour
Details of the higher timeframe are omitted.
In the above 1-hour chart,the previous updated highwas approached andthe mBDSR (MA 2-filter) pullback buy signalwas triggered, and prices have risen steadily from right after that.
As repeatedly written in articles up to now,the previous updated highoften functions as a support level.
From this example,a trading method focused on the previous updated highandthe BDSR signalsshow a high degree of compatibility.
※Note: In the charts introduced in this article, for convenience of explanation, circles, lines, and rectangles may be drawn.
Indicator【BODSOR・mBDSR】that shines in combination with RCI
Methods・Case Studies (PDF) ★GogoJungle AWARD2020 Winner★
https://www.gogojungle.co.jp/tools/indicators/11836
The PDF file contains 358 files (over 1,400 pages, over 470,000 characters in total).
Many of them summarize examples that link higher and lower timeframes logically using three RCI lines to consider the state of multiple lower timeframes step by step, and ultimately wait for dips or pullback buy signals on the lower timeframe (i.e., mBDSR signals).
Also,many entries focus on identifying points where multiple entry reasons overlap.
Additionally,it includes methods to explore upside and downside targets using the three RCI lines..
In the PDF explanations,there are over 1,350 charts used..
× ![]()


