

[Today's 2024/12/06 EUR/JPY] RCI three-line method and the moving average considered important, and the mBDSR (RCI two-line filter) dip-buy signal
0
【Mastering RCI!! Trend Reversal, Buy on Dips, Sell on Rallies】
Indicator that shines when combined with RCI【BODSOR・mBDSR】
and Method・Case Studies (PDF) ★GogoJungle AWARD2020 winner★
https://www.gogojungle.co.jp/tools/indicators/11836
Euro/Yen EURJPY 4-hour chart
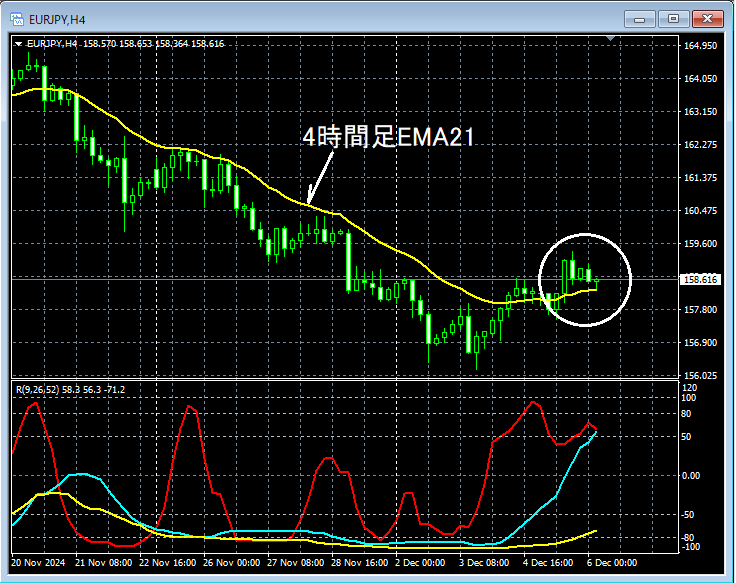
Looking at the above 4-hour chart, it has clearly broken above what has been acting as resistance4-hour EMA21and has pulled back to this moving average. It might not be surprising if there is a slight rebound in this area. We will cautiously look for signs of reversal on lower timeframes around the white circle.
In this case,RCI three-lineallows you to descend from higher to lower timeframes “like solving a puzzle” to set up a dip-buy signal, but the explanation of that method is left to the attached PDF. Below, we are looking at a 1-minute chart, not just checking it arbitrarily.
Euro/Yen EURJPY 1-minute chart
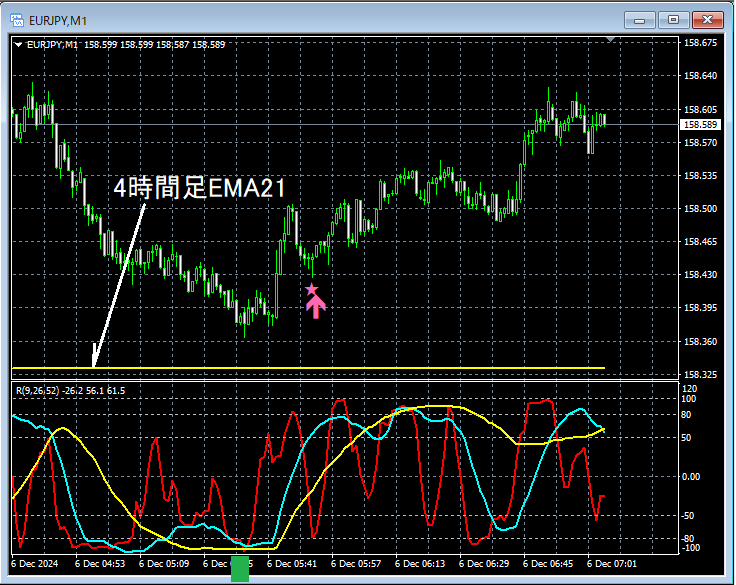
Looking at the above 1-minute chart,RCI three-lineis, so to speak,RCI triple bottom15-minute EMA200. Afterwards,mBDSR (RCI two-line filter) dip-buy signallights up and price rises firmly.RCI triple bottomrebound pattern.
From this example,a trading approach emphasizing rebounds at RCI three-line and moving averagesandsignals of mBDSRshows a strong compatibility.
※Please note that the charts shown in this article may include added circles, lines, and boxes for explanation convenience.
Indicator that shines when combined with RCI【BODSOR・mBDSR】
and Method・Case Studies (PDF) ★GogoJungle AWARD2020 winner★
https://www.gogojungle.co.jp/tools/indicators/11836
The PDF file contains 358 items (over 1,400 pages, over 470k characters in total).
Most of them areexamples that link multiple lower timeframes logically using the RCI three-line to discuss the status of various lower timeframes sequentially, ultimately setting up dip-buy or rally-sell timing (i.e., mBDSR signals) on the lower timeframes.
Additionally,many focus on capturing points where multiple entry reasons overlap.
Furthermore,there are also methods to explore upside and downside targets using RCI three-line.
In the PDF explanations,more than 1,350 chartsare used.

Indicator that shines when combined with RCI【BODSOR・mBDSR】
and Method・Case Studies (PDF) ★GogoJungle AWARD2020 winner★
https://www.gogojungle.co.jp/tools/indicators/11836
Euro/Yen EURJPY 4-hour chart
Looking at the above 4-hour chart, it has clearly broken above what has been acting as resistance4-hour EMA21and has pulled back to this moving average. It might not be surprising if there is a slight rebound in this area. We will cautiously look for signs of reversal on lower timeframes around the white circle.
In this case,RCI three-lineallows you to descend from higher to lower timeframes “like solving a puzzle” to set up a dip-buy signal, but the explanation of that method is left to the attached PDF. Below, we are looking at a 1-minute chart, not just checking it arbitrarily.
Euro/Yen EURJPY 1-minute chart
Looking at the above 1-minute chart,RCI three-lineis, so to speak,RCI triple bottom15-minute EMA200. Afterwards,mBDSR (RCI two-line filter) dip-buy signallights up and price rises firmly.RCI triple bottomrebound pattern.
From this example,a trading approach emphasizing rebounds at RCI three-line and moving averagesandsignals of mBDSRshows a strong compatibility.
※Please note that the charts shown in this article may include added circles, lines, and boxes for explanation convenience.
Indicator that shines when combined with RCI【BODSOR・mBDSR】
and Method・Case Studies (PDF) ★GogoJungle AWARD2020 winner★
https://www.gogojungle.co.jp/tools/indicators/11836
The PDF file contains 358 items (over 1,400 pages, over 470k characters in total).
Most of them areexamples that link multiple lower timeframes logically using the RCI three-line to discuss the status of various lower timeframes sequentially, ultimately setting up dip-buy or rally-sell timing (i.e., mBDSR signals) on the lower timeframes.
Additionally,many focus on capturing points where multiple entry reasons overlap.
Furthermore,there are also methods to explore upside and downside targets using RCI three-line.
In the PDF explanations,more than 1,350 chartsare used.
× ![]()


