

[Today 2024/12/06 AUDUSD] Important moving averages, neckline, and mBDSR rebound selling signal that I am watching
0
【Mastering RCI!! Trend Reversals, Buy the Dip, Sell the Rally】
Indicator 【BODSOR・mBDSR】 that demonstrates power when used with RCI
and Method & Case Studies (PDF) ★GogoJungle AWARD2020 winner★
https://www.gogojungle.co.jp/tools/indicators/11836
mBDSR (RCI Filter)andmBDSR (Moving Average Filter)play different roles. The above PDF also touches on how to use these appropriately.
Below,mBDSR (Moving Average Filter)signs will be introduced with examples.
AUD/USD 5-minute chart
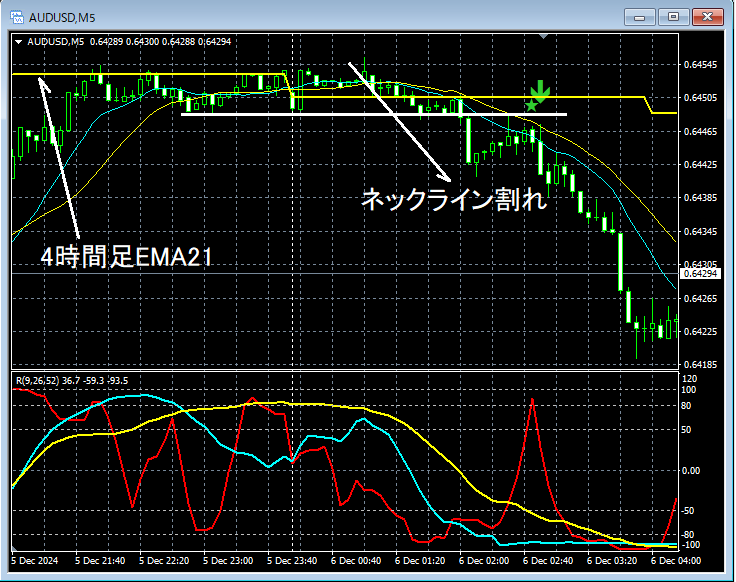
The higher-timeframe conditions are omitted.
In this case, the important moving average is4-hour EMA21to consider potential pullbacks.4-hour EMA21from near this level,necklinebreaks. Then, from near thenecklinearea, it rose,mBDSR pullback-sell signallights up, indicating that the price is declining smoothly.
From this example,a trading method focused on moving averages and necklinesandthe signals from mBDSRshow strong compatibility.
Additionally, in this example, placing the stop-loss just above the recent highrecent highallows for a high reward-to-risk trade.
※Please note that the charts presented in this article may include added shapes like circles, lines, or squares for explanation clarity.
Indicator 【BODSOR・mBDSR】 that shines when combined with RCI
and Method & Case Studies (PDF) ★GogoJungle AWARD2020 winner★
https://www.gogojungle.co.jp/tools/indicators/11836
The PDF file has 358 items (over 1,400 pages, over 470,000 characters).
Many of them are collections that, by linking the higher and lower timeframes logically using the RCI 3-line setup, sequentially examines the状況 of multiple lower timeframes, and ultimately arrives at waiting for pullbacks or pullbacks (i.e., mBDSR signals) on the lower timeframe.
Additionally,many focus on identifying points where multiple entry criteria align..
Also included is a method to explore upside and downside targets using the RCI 3-line setup.
In the PDF explanations,more than 1,350 chartsare used.

Indicator 【BODSOR・mBDSR】 that demonstrates power when used with RCI
and Method & Case Studies (PDF) ★GogoJungle AWARD2020 winner★
https://www.gogojungle.co.jp/tools/indicators/11836
mBDSR (RCI Filter)andmBDSR (Moving Average Filter)play different roles. The above PDF also touches on how to use these appropriately.
Below,mBDSR (Moving Average Filter)signs will be introduced with examples.
AUD/USD 5-minute chart
The higher-timeframe conditions are omitted.
In this case, the important moving average is4-hour EMA21to consider potential pullbacks.4-hour EMA21from near this level,necklinebreaks. Then, from near thenecklinearea, it rose,mBDSR pullback-sell signallights up, indicating that the price is declining smoothly.
From this example,a trading method focused on moving averages and necklinesandthe signals from mBDSRshow strong compatibility.
Additionally, in this example, placing the stop-loss just above the recent highrecent highallows for a high reward-to-risk trade.
※Please note that the charts presented in this article may include added shapes like circles, lines, or squares for explanation clarity.
Indicator 【BODSOR・mBDSR】 that shines when combined with RCI
and Method & Case Studies (PDF) ★GogoJungle AWARD2020 winner★
https://www.gogojungle.co.jp/tools/indicators/11836
The PDF file has 358 items (over 1,400 pages, over 470,000 characters).
Many of them are collections that, by linking the higher and lower timeframes logically using the RCI 3-line setup, sequentially examines the状況 of multiple lower timeframes, and ultimately arrives at waiting for pullbacks or pullbacks (i.e., mBDSR signals) on the lower timeframe.
Additionally,many focus on identifying points where multiple entry criteria align..
Also included is a method to explore upside and downside targets using the RCI 3-line setup.
In the PDF explanations,more than 1,350 chartsare used.
× ![]()


