

【Yesterday 2024/12/05 Pound/Yen】Notable highs on the higher time frame and a pullback buying signal on the lower time frame mBDSR (RCI two-band filter)
0
Indicator that demonstrates its power in combination with RCI【BODSOR・mBDSR】
and methodology/case studies (PDF) ★GogoJungle AWARD2020 recipient★
https://www.gogojungle.co.jp/tools/indicators/11836
GBPJPY – Pound-Yen 1-hour chart
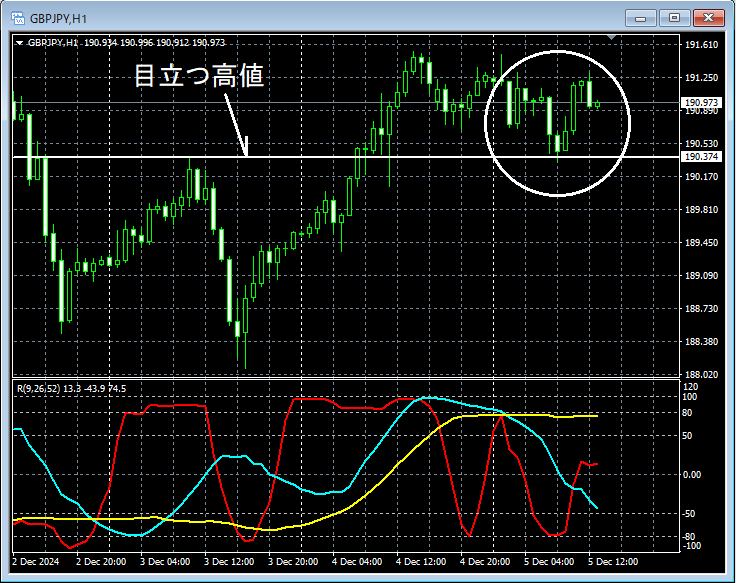
Looking at the area circled in white on the 1-hour chart above,you can see it has fallen toward notable past highsnearby. It may not be unusual to expect a slight rise. We will look for signs of a rebound on lower timeframes.
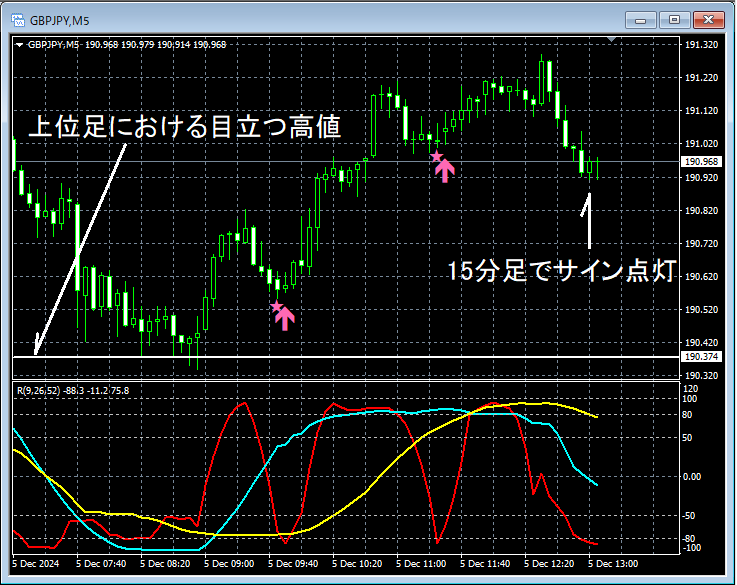
GBPJPY – Pound-Yen 5-minute chart
GBPJPY – Pound-Yen 15-minute chart
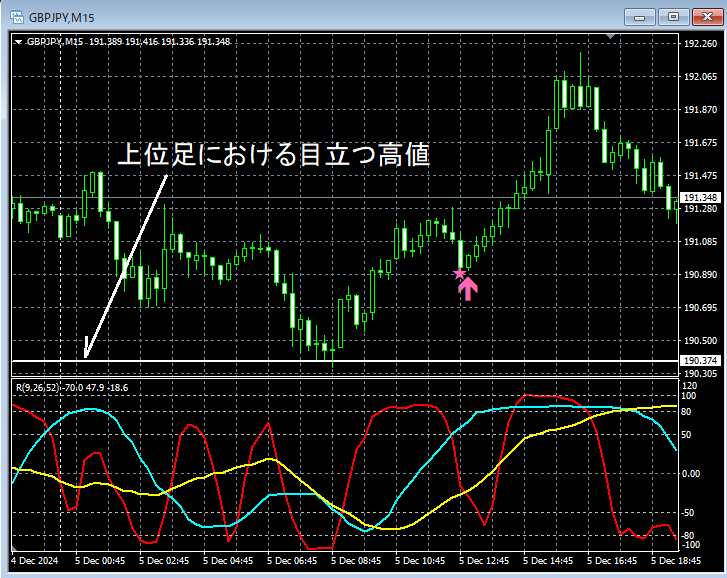
On the 15-minute and 5-minute charts above,after falling toward notable past highs on higher timeframesit rebounds.mBDSR (2-filter RCI) buy-the-dip signallights up, and price continues to rise firmly.
From this example,a trading method focusing on past notable highsandthe signals of mBDSRshow high compatibility.
※ Please note that for convenience in this article, some charts may include added circles, lines, or rectangles for explanation purposes.
Indicator that demonstrates its power in combination with RCI【BODSOR・mBDSR】
and methodology/case studies (PDF) ★GogoJungle AWARD2020 recipient★
https://www.gogojungle.co.jp/tools/indicators/11836
The PDF file includes 358 items (more than 1,400 pages, more than 470,000 characters).
Most of them aresummaries of how multiple lower timeframes are sequentially considered by logically linking higher and lower timeframes using three RCI lines, ultimately waiting for pullbacks or pullback entries on the lower timeframes (i.e., mBDSR signals)..
Additionally,many focus on identifying overlapping reasons for entry at the same point.
Furthermore,there are methods that explore rising and falling targets using three RCI linesas well.
In the PDF explanations,over 1,350 chartsare used.

and methodology/case studies (PDF) ★GogoJungle AWARD2020 recipient★
https://www.gogojungle.co.jp/tools/indicators/11836
GBPJPY – Pound-Yen 1-hour chart
Looking at the area circled in white on the 1-hour chart above,you can see it has fallen toward notable past highsnearby. It may not be unusual to expect a slight rise. We will look for signs of a rebound on lower timeframes.
GBPJPY – Pound-Yen 5-minute chart
GBPJPY – Pound-Yen 15-minute chart
On the 15-minute and 5-minute charts above,after falling toward notable past highs on higher timeframesit rebounds.mBDSR (2-filter RCI) buy-the-dip signallights up, and price continues to rise firmly.
From this example,a trading method focusing on past notable highsandthe signals of mBDSRshow high compatibility.
※ Please note that for convenience in this article, some charts may include added circles, lines, or rectangles for explanation purposes.
Indicator that demonstrates its power in combination with RCI【BODSOR・mBDSR】
and methodology/case studies (PDF) ★GogoJungle AWARD2020 recipient★
https://www.gogojungle.co.jp/tools/indicators/11836
The PDF file includes 358 items (more than 1,400 pages, more than 470,000 characters).
Most of them aresummaries of how multiple lower timeframes are sequentially considered by logically linking higher and lower timeframes using three RCI lines, ultimately waiting for pullbacks or pullback entries on the lower timeframes (i.e., mBDSR signals)..
Additionally,many focus on identifying overlapping reasons for entry at the same point.
Furthermore,there are methods that explore rising and falling targets using three RCI linesas well.
In the PDF explanations,over 1,350 chartsare used.
× ![]()


