

Mastering RCI!! Dollar-Yen Chart Study: Break above the retracement high and the previously updated high, and the mBDSR signal
0
【Mastering RCI!! Trend Reversals, Buy Dips, and Sell Rallies】
Indicator that shines in combination with RCI: 【BODSOR・mBDSR】
Methods and Case Studies (PDF) ★GogoJungle AWARD2020 recipient★
https://www.gogojungle.co.jp/tools/indicators/11836
mBDSR (RCI Filter)andmBDSR (Moving Average Filter)have different roles. The usage distinctions are touched upon in the PDF above.
Below,mBDSR (Moving Average Filter)signal examples are introduced.
USDJPY – USDJPY, 4-hour chart
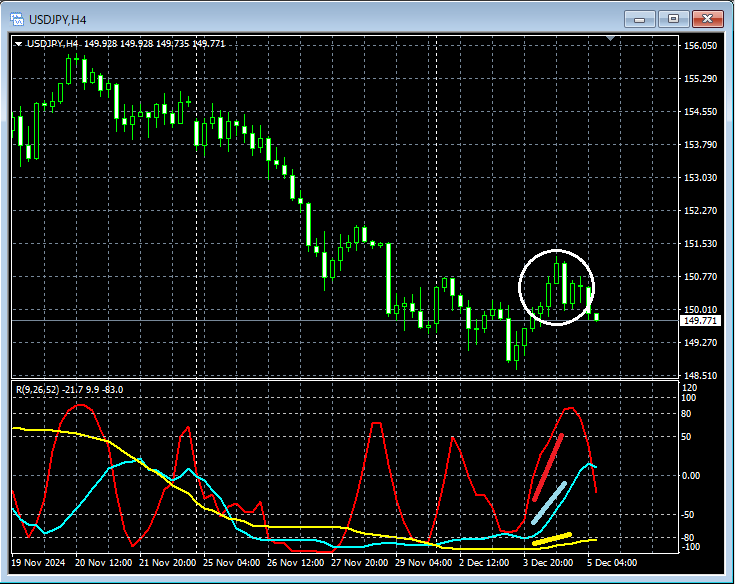
In the above 4-hour chart,Three RCI linesall rising together, forming a very strong bullish setup. It is not strange to consider buying on dips on the lower timeframe. We will carefully examine around the area enclosed by the white circle on the lower timeframe.
In this case,RCI three-linecan be used to drive the lower timeframe into a state where you wait for a dip-buy signal "like solving a puzzle," and to anticipate the rise target of RCI, but the explanation of that method is left to the attached PDF. Here, we are looking at the 1-hour and 5-minute charts, not by mere chance but purposefully.
USDJPY – USDJPY, 1-hour chart
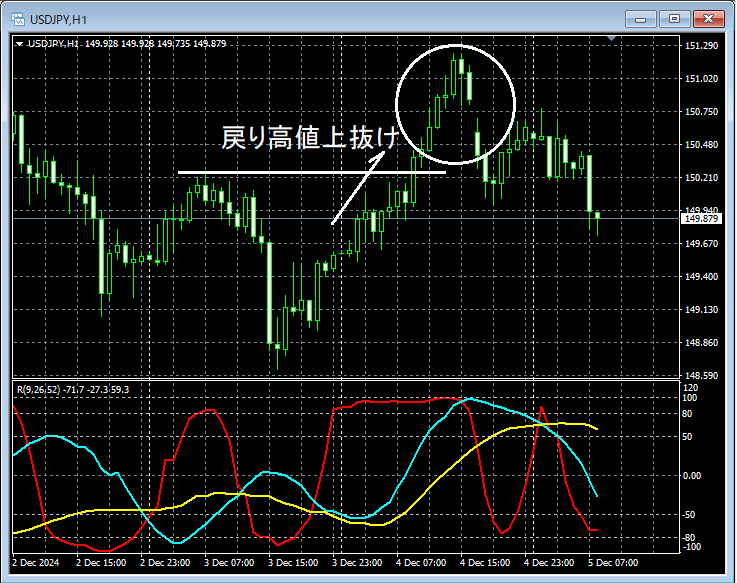
In the above 1-hour chart,Return highbreaks above. The downtrend is temporarily negated. It is a scenario where buying on dips on the lower timeframe is reasonable. We will further inspect around the area enclosed by the white circle on the lower timeframe.
USDJPY – USDJPY, 5-minute chart
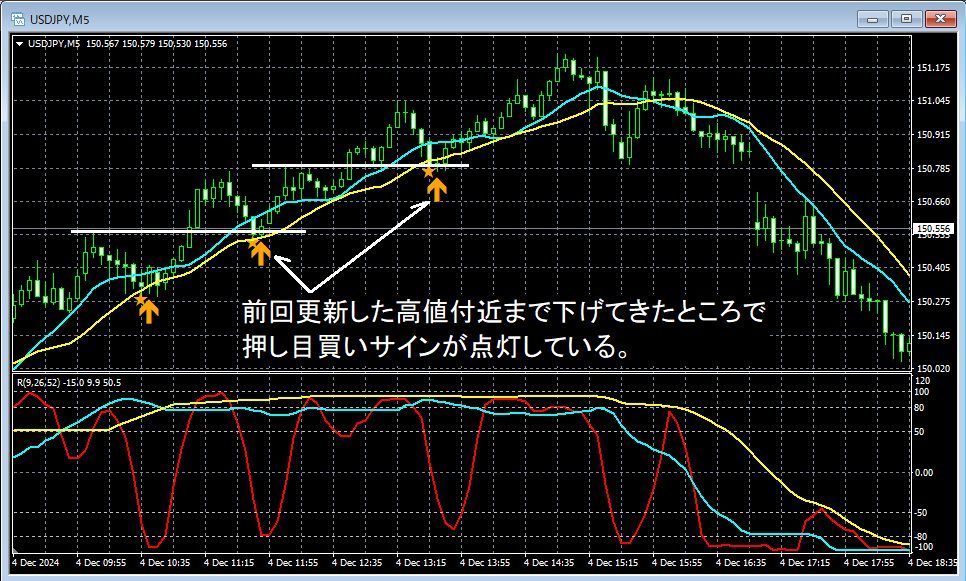
In the above 5-minute chart,mBDSR (MA two-filter)dip-buy signals light up three times. All three signals occur before the rise target of theRCI three-line rise targetis reached, and two of the signals occur near thepreviously updated highjust before turning down.
As discussed in many articles,previously updated highoften functions as support. The second and third signals may carry one more entry rationale than the first signal.
From this example,the high compatibility of trades focusing on the CCI three-line, bounce highs (Dow Theory), and prior highs withmBDSR signalsis evident.
※Note: In the charts shown in this article, for ease of explanation, circles, lines, and boxes may be added.
Indicator that shines in combination with RCI【BODSOR・mBDSR】
and the methodology & case studies (PDF) ★GogoJungle AWARD2020 recipient★
https://www.gogojungle.co.jp/tools/indicators/11836
The PDF file includes 358 items (over 1,400 pages, over 470,000 Japanese characters).
Many of them are compiled to show how to logically link higher and lower timeframes using the RCI three-line, progressively analyzing multiple lower timeframes, and ultimately waiting for dips or pullbacks signals on the lower timeframes (i.e., mBDSR signals).
Additionally,many entries emphasize identifying points where multiple entry reasons overlap..
Moreover,there are methods that explore upside and downside targets using the RCI three-line..
In the PDF explanations,more than 1,350 chartsare used.

Indicator that shines in combination with RCI: 【BODSOR・mBDSR】
Methods and Case Studies (PDF) ★GogoJungle AWARD2020 recipient★
https://www.gogojungle.co.jp/tools/indicators/11836
mBDSR (RCI Filter)andmBDSR (Moving Average Filter)have different roles. The usage distinctions are touched upon in the PDF above.
Below,mBDSR (Moving Average Filter)signal examples are introduced.
USDJPY – USDJPY, 4-hour chart
In the above 4-hour chart,Three RCI linesall rising together, forming a very strong bullish setup. It is not strange to consider buying on dips on the lower timeframe. We will carefully examine around the area enclosed by the white circle on the lower timeframe.
In this case,RCI three-linecan be used to drive the lower timeframe into a state where you wait for a dip-buy signal "like solving a puzzle," and to anticipate the rise target of RCI, but the explanation of that method is left to the attached PDF. Here, we are looking at the 1-hour and 5-minute charts, not by mere chance but purposefully.
USDJPY – USDJPY, 1-hour chart
In the above 1-hour chart,Return highbreaks above. The downtrend is temporarily negated. It is a scenario where buying on dips on the lower timeframe is reasonable. We will further inspect around the area enclosed by the white circle on the lower timeframe.
USDJPY – USDJPY, 5-minute chart
In the above 5-minute chart,mBDSR (MA two-filter)dip-buy signals light up three times. All three signals occur before the rise target of theRCI three-line rise targetis reached, and two of the signals occur near thepreviously updated highjust before turning down.
As discussed in many articles,previously updated highoften functions as support. The second and third signals may carry one more entry rationale than the first signal.
From this example,the high compatibility of trades focusing on the CCI three-line, bounce highs (Dow Theory), and prior highs withmBDSR signalsis evident.
※Note: In the charts shown in this article, for ease of explanation, circles, lines, and boxes may be added.
Indicator that shines in combination with RCI【BODSOR・mBDSR】
and the methodology & case studies (PDF) ★GogoJungle AWARD2020 recipient★
https://www.gogojungle.co.jp/tools/indicators/11836
The PDF file includes 358 items (over 1,400 pages, over 470,000 Japanese characters).
Many of them are compiled to show how to logically link higher and lower timeframes using the RCI three-line, progressively analyzing multiple lower timeframes, and ultimately waiting for dips or pullbacks signals on the lower timeframes (i.e., mBDSR signals).
Additionally,many entries emphasize identifying points where multiple entry reasons overlap..
Moreover,there are methods that explore upside and downside targets using the RCI three-line..
In the PDF explanations,more than 1,350 chartsare used.
× ![]()


