

[Yesterday 2024.12.04 USD/JPY] Noticeable lows and a double top and mBDSR (RCI two-filter) sell signal
0
【Mastering RCI!! Trend Reversals, Buy on Dips, Sell on Retracements】
Indicator that excels when used in combination with RCI: 【BODSOR・mBDSR】
Methods, case studies (PDF) ★GogoJungle AWARD2020 winner★
https://www.gogojungle.co.jp/tools/indicators/11836
USDJPY - Dollar/Yen - Daily Chart
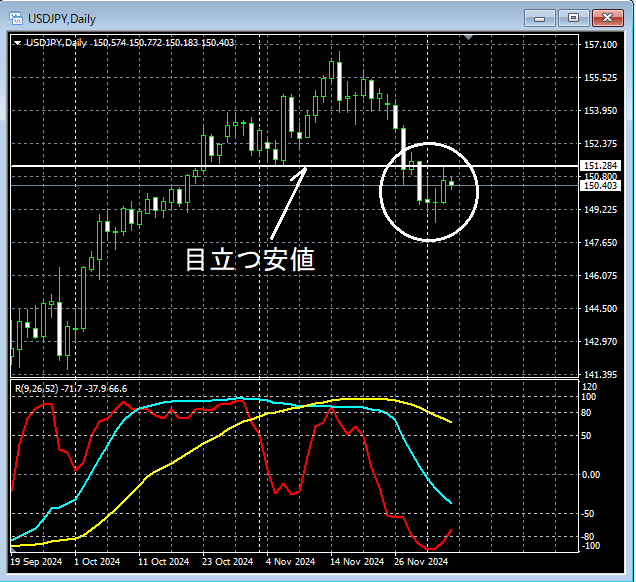
On the higher time frame, focus on the notable low that seems likely to act as resistance for now.Prominent LowYesterday, it rose close to thisProminent Lowarea, making a pullback possible. On lower time frames, carefully watch for signs of a pullback.
In this case, using three RCI lines allows you to drag the wait-for-retracement pattern on the lower time frame like solving a puzzle, but the explanation of that method is left to the included PDF. Here, a 5-minute chart is used, but not chosen arbitrarily.
USDJPY - Dollar/Yen - 5-Minute Chart
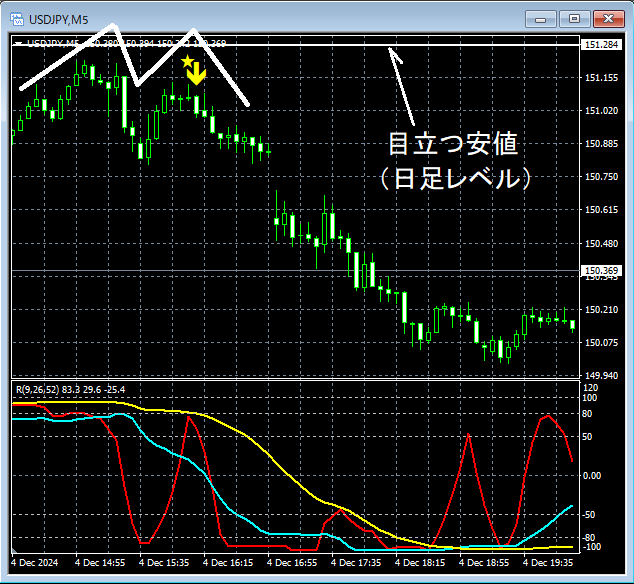
On the upper 5-minute chart,Near the notable daily lowIt rises and then shows a pullback. Subsequently,mBDSR (Two RCI lines filter)sells signals light up, and price moves lower firmly.
As a result,A move starts at the right peak of a Double Topwhere the decline begins is captured effectively.
From this example,a trading method focusing on notable lows and double topsandthe signals of mBDSRshow high compatibility.
Also in this example, placing the stop loss slightly above the most recent high (left peak of the double top)allows for favorable risk-reward trades.
※Please note that the charts introduced in this article may include added circles, lines, and rectangles for explanatory convenience.
Indicator that excels when used in combination with RCI: 【BODSOR・mBDSR】
Methods, case studies (PDF) ★GogoJungle AWARD2020 winner★
https://www.gogojungle.co.jp/tools/indicators/11836
The PDF file includes 358 items (over 1,400 pages, over 470,000 characters in total).
Many of these are compiled as examples that break down how to logically link higher and lower time frames using three RCI lines, guiding multiple lower-time-frame conditions and finally waiting for buy-the-dip or sell-the-rally timings (i.e., mBDSR signals) on the lower time frame.
Additionally,there are many items focusing on identifying points where multiple entry reasons converge..
Furthermore,there are methods for exploring upside and downside targets using three RCI lines..
In the PDF explanations,there are over 1,350 charts used..

Indicator that excels when used in combination with RCI: 【BODSOR・mBDSR】
Methods, case studies (PDF) ★GogoJungle AWARD2020 winner★
https://www.gogojungle.co.jp/tools/indicators/11836
USDJPY - Dollar/Yen - Daily Chart
On the higher time frame, focus on the notable low that seems likely to act as resistance for now.Prominent LowYesterday, it rose close to thisProminent Lowarea, making a pullback possible. On lower time frames, carefully watch for signs of a pullback.
In this case, using three RCI lines allows you to drag the wait-for-retracement pattern on the lower time frame like solving a puzzle, but the explanation of that method is left to the included PDF. Here, a 5-minute chart is used, but not chosen arbitrarily.
USDJPY - Dollar/Yen - 5-Minute Chart
On the upper 5-minute chart,Near the notable daily lowIt rises and then shows a pullback. Subsequently,mBDSR (Two RCI lines filter)sells signals light up, and price moves lower firmly.
As a result,A move starts at the right peak of a Double Topwhere the decline begins is captured effectively.
From this example,a trading method focusing on notable lows and double topsandthe signals of mBDSRshow high compatibility.
Also in this example, placing the stop loss slightly above the most recent high (left peak of the double top)allows for favorable risk-reward trades.
※Please note that the charts introduced in this article may include added circles, lines, and rectangles for explanatory convenience.
Indicator that excels when used in combination with RCI: 【BODSOR・mBDSR】
Methods, case studies (PDF) ★GogoJungle AWARD2020 winner★
https://www.gogojungle.co.jp/tools/indicators/11836
The PDF file includes 358 items (over 1,400 pages, over 470,000 characters in total).
Many of these are compiled as examples that break down how to logically link higher and lower time frames using three RCI lines, guiding multiple lower-time-frame conditions and finally waiting for buy-the-dip or sell-the-rally timings (i.e., mBDSR signals) on the lower time frame.
Additionally,there are many items focusing on identifying points where multiple entry reasons converge..
Furthermore,there are methods for exploring upside and downside targets using three RCI lines..
In the PDF explanations,there are over 1,350 charts used..
× ![]()


