

【Today 2024.12.04 AUDCHF】 Australia) Indicator release and breaking below the pressed low, and mBDSR (RCI 2-filter) selling signal on the return move
【Mastering RCI!! Trend Reversals, Buy on Dips, Sell on Rallies】
Indicator 【BODSOR・mBDSR】 that shines in combination with RCI
and methods / case studies (PDF) ★GogoJungle AWARD 2020 Awarded★
https://www.gogojungle.co.jp/tools/indicators/11836
Australia Swiss AUDCHF 5-minute chart
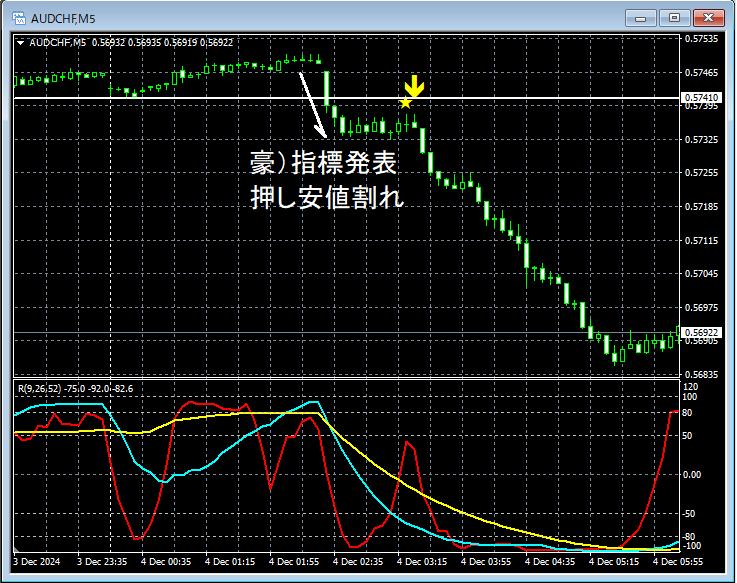
On the above 5-minute chart,after the news releasethe price dropped below theswing lowwhich temporarily negated the uptrend. Then, on the subsequent rise,mBDSR (2 RCI lines filter)sell signal appeared, and price subsequently moved firmly downward.
From this example,a trading method focused on Dow Theoryandthe compatibility with mBDSR signalsappear to be highly aligned.
※Please note that in the charts introduced in this article, for ease of explanation, circles, lines, and rectangles may have been added.
Indicator 【BODSOR・mBDSR】 that shines in combination with RCI
and methods / case studies (PDF) ★GogoJungle AWARD 2020 Awarded★
https://www.gogojungle.co.jp/tools/indicators/11836
The PDF file includes 358 items (over 1,400 pages, over 470,000 characters in total).
Most of these areexamples that link multiple higher and lower timeframes logically using the RCI3-line, and finally lay out a scenario that waits for a dip-buy on the lower timeframes or a rally-sell timing (i.e., an mBDSR signal).in which the lower-timeframe timing is determined.
Additionally,many items emphasize identifying points where multiple entry rationales overlap.There are many such cases.
Also included is a method to explore upward and downward targets using the RCI3-line.
In the explanation within the PDF file,more than 1,350 chartsare used.

Indicator 【BODSOR・mBDSR】 that shines in combination with RCI
and methods / case studies (PDF) ★GogoJungle AWARD 2020 Awarded★
https://www.gogojungle.co.jp/tools/indicators/11836
Australia Swiss AUDCHF 5-minute chart
On the above 5-minute chart,after the news releasethe price dropped below theswing lowwhich temporarily negated the uptrend. Then, on the subsequent rise,mBDSR (2 RCI lines filter)sell signal appeared, and price subsequently moved firmly downward.
From this example,a trading method focused on Dow Theoryandthe compatibility with mBDSR signalsappear to be highly aligned.
※Please note that in the charts introduced in this article, for ease of explanation, circles, lines, and rectangles may have been added.
Indicator 【BODSOR・mBDSR】 that shines in combination with RCI
and methods / case studies (PDF) ★GogoJungle AWARD 2020 Awarded★
https://www.gogojungle.co.jp/tools/indicators/11836
The PDF file includes 358 items (over 1,400 pages, over 470,000 characters in total).
Most of these areexamples that link multiple higher and lower timeframes logically using the RCI3-line, and finally lay out a scenario that waits for a dip-buy on the lower timeframes or a rally-sell timing (i.e., an mBDSR signal).in which the lower-timeframe timing is determined.
Additionally,many items emphasize identifying points where multiple entry rationales overlap.There are many such cases.
Also included is a method to explore upward and downward targets using the RCI3-line.
In the explanation within the PDF file,more than 1,350 chartsare used.
× ![]()


