

[Today 2024.12.04 Euro-Yen] Break above resistance and mbDSR (RCI 2-filter) pullback buying signal
【Mastering RCI!! Trend Reversal, Buy on Dips, Sell on Rallies】
Indicator 【BODSOR・mBDSR】 that delivers powerful performance when combined with RCI
Methods & Case Studies (PDF) ★GogoJungle AWARD2020 Winner★
https://www.gogojungle.co.jp/tools/indicators/11836
EUR/JPY 5-minute chart
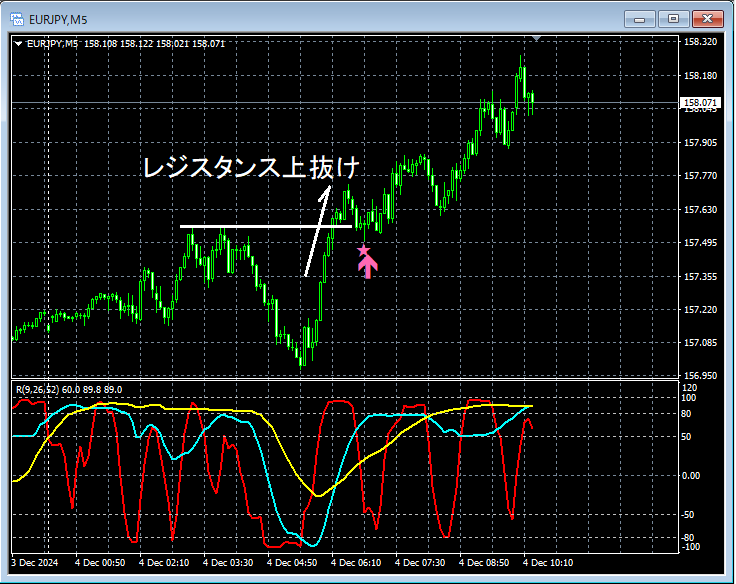
On the 5-minute chart above,Resistanceis broken to the upside, and in the subsequent pullbackmBDSR (RCI two-line filter)buying signal lights up, and price subsequently rises firmly.
From this example,a trading approach focused on Dow Theoryandthe signals of mBDSRshow strong compatibility.
※Please note that in the charts mentioned in this article, for convenience of explanation, circles, straight lines, and rectangles may have been added.
Indicator 【BODSOR・mBDSR】 that delivers powerful performance when combined with RCI
Methods & Case Studies (PDF) ★GogoJungle AWARD2020 Winner★
https://www.gogojungle.co.jp/tools/indicators/11836
The PDF file includes 358 items (over 1,400 pages, over 470,000 characters total).
Most of them are summarized as examples that logically link higher timeframes and lower timeframes using three RCI lines, and ultimately wait for a dip-buy or pullback timing on the lower timeframe (i.e., signals from mBDSR).
Also,many entries focus on points where multiple entry reasons overlap..
Additionally,there are methods using the three-RCI-line to explore upside targets and downside targets..
In the PDF explanations,over 1,350 chartsare used.

Indicator 【BODSOR・mBDSR】 that delivers powerful performance when combined with RCI
Methods & Case Studies (PDF) ★GogoJungle AWARD2020 Winner★
https://www.gogojungle.co.jp/tools/indicators/11836
EUR/JPY 5-minute chart
On the 5-minute chart above,Resistanceis broken to the upside, and in the subsequent pullbackmBDSR (RCI two-line filter)buying signal lights up, and price subsequently rises firmly.
From this example,a trading approach focused on Dow Theoryandthe signals of mBDSRshow strong compatibility.
※Please note that in the charts mentioned in this article, for convenience of explanation, circles, straight lines, and rectangles may have been added.
Indicator 【BODSOR・mBDSR】 that delivers powerful performance when combined with RCI
Methods & Case Studies (PDF) ★GogoJungle AWARD2020 Winner★
https://www.gogojungle.co.jp/tools/indicators/11836
The PDF file includes 358 items (over 1,400 pages, over 470,000 characters total).
Most of them are summarized as examples that logically link higher timeframes and lower timeframes using three RCI lines, and ultimately wait for a dip-buy or pullback timing on the lower timeframe (i.e., signals from mBDSR).
Also,many entries focus on points where multiple entry reasons overlap..
Additionally,there are methods using the three-RCI-line to explore upside targets and downside targets..
In the PDF explanations,over 1,350 chartsare used.
× ![]()


