

Indicator 발표 and mBDSR (RCI2 two-filter) signal
0
【 Mastering RCI!! Trend Reversals, Buy Dips, Sell on Rallies】
Indicator【BODSOR・mBDSR】that shows power when used with RCI
and techniques and case studies (PDF) ★GogoJungle AWARD2020 winner★
https://www.gogojungle.co.jp/tools/indicators/11836
AUD/USD 5-minute chart
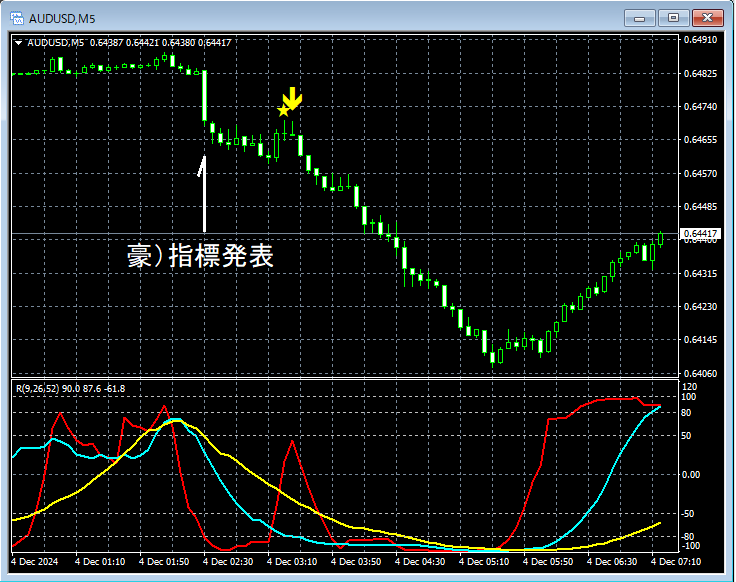
On the 5-minute chart above,after a drop due to an economic indicator releasethe mBDSR (RCI double-filter) sell signallights up and the price drops sharply.and the subsequent pullback can often be captured wellIn this example, the price action after the indicator releaseby the mBDSR signal.
As in this example,the behavior after the indicator releasecan be effectively captured bythe mBDSR signalsin some cases.
※Please note that the charts introduced in this article may include added circles, lines, or rectangles for convenience of explanation.
Indicator【BODSOR・mBDSR】that shows power when used with RCI
and techniques and case studies (PDF) ★GogoJungle AWARD2020 winner★
https://www.gogojungle.co.jp/tools/indicators/11836
The PDF file includes 358 items (over 1,400 pages, over 470,000 characters in total).
Most of them are compiled in a way that links the higher time frame and lower time frames logically using three RCI lines, so as to assess the situation on multiple lower time frames sequentially, ultimately waiting for dip-buying or pullback selling timing (i.e., mBDSR signals) on the lower time frame.This is the general approach.
Also,many entries focus on identifying points where multiple entry reasons overlap.
Additionally,there are methods that explore ascent and descent targets using three RCI lines.
In the explanations within the PDF file,more than 1,350 chartsare used.

Indicator【BODSOR・mBDSR】that shows power when used with RCI
and techniques and case studies (PDF) ★GogoJungle AWARD2020 winner★
https://www.gogojungle.co.jp/tools/indicators/11836
AUD/USD 5-minute chart
On the 5-minute chart above,after a drop due to an economic indicator releasethe mBDSR (RCI double-filter) sell signallights up and the price drops sharply.and the subsequent pullback can often be captured wellIn this example, the price action after the indicator releaseby the mBDSR signal.
As in this example,the behavior after the indicator releasecan be effectively captured bythe mBDSR signalsin some cases.
※Please note that the charts introduced in this article may include added circles, lines, or rectangles for convenience of explanation.
Indicator【BODSOR・mBDSR】that shows power when used with RCI
and techniques and case studies (PDF) ★GogoJungle AWARD2020 winner★
https://www.gogojungle.co.jp/tools/indicators/11836
The PDF file includes 358 items (over 1,400 pages, over 470,000 characters in total).
Most of them are compiled in a way that links the higher time frame and lower time frames logically using three RCI lines, so as to assess the situation on multiple lower time frames sequentially, ultimately waiting for dip-buying or pullback selling timing (i.e., mBDSR signals) on the lower time frame.This is the general approach.
Also,many entries focus on identifying points where multiple entry reasons overlap.
Additionally,there are methods that explore ascent and descent targets using three RCI lines.
In the explanations within the PDF file,more than 1,350 chartsare used.
× ![]()


