

Breakout above the prior high and mBDSR (RCI double-filter) pullback buying signal
0
【Mastering RCI!! Trend Reversal, Buy on Dips, Sell on Rallies】
Indicator 【BODSOR・mBDSR】 that shines when combined with RCI
and techniques, case studies (PDF) ★GogoJungle AWARD 2020 Winner★
https://www.gogojungle.co.jp/tools/indicators/11836
Swiss Franc/Yen CHFJPY 5-minute chart
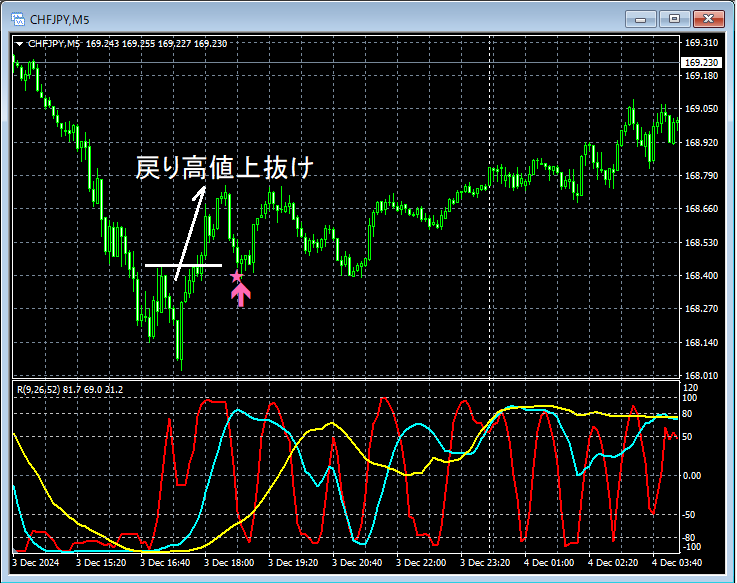
In the 5-minute chart above, a rebound from a downtrend. Andthe breakout above the swing highand subsequent decline,mBDSR (filter: RCI26 and RCI52) Buy-the-Dip signallights up and price is clearly rising.
From this example,a trading approach focused on swing highs (Dow Theory)andthe harmony with mBDSR signalsare evident.
※Please note that in the charts introduced in this article, for convenience of explanation, circles, lines, and rectangles may be added.
Indicator 【BODSOR・mBDSR】 that shines when combined with RCI
and techniques, case studies (PDF) ★GogoJungle AWARD 2020 Winner★
https://www.gogojungle.co.jp/tools/indicators/11836
The PDF file includes 358 items (over 1,400 pages, over 470,000 characters).
Many of themexplain how to logically link higher and lower timeframes using three RCI lines to examine multiple lower-timeframe situations sequentially, ultimately waiting for dip-buy or rally-sell timing on lower timeframes (i.e., mBDSR signals)..
Additionally,there are many that emphasize pinpointing entry points where multiple entry justifications overlap..
Furthermore,there are methods that explore upside and downside targets using three RCI lines..
In the explanations within the PDF file,over 1,350 chartsare used.

Indicator 【BODSOR・mBDSR】 that shines when combined with RCI
and techniques, case studies (PDF) ★GogoJungle AWARD 2020 Winner★
https://www.gogojungle.co.jp/tools/indicators/11836
Swiss Franc/Yen CHFJPY 5-minute chart
In the 5-minute chart above, a rebound from a downtrend. Andthe breakout above the swing highand subsequent decline,mBDSR (filter: RCI26 and RCI52) Buy-the-Dip signallights up and price is clearly rising.
From this example,a trading approach focused on swing highs (Dow Theory)andthe harmony with mBDSR signalsare evident.
※Please note that in the charts introduced in this article, for convenience of explanation, circles, lines, and rectangles may be added.
Indicator 【BODSOR・mBDSR】 that shines when combined with RCI
and techniques, case studies (PDF) ★GogoJungle AWARD 2020 Winner★
https://www.gogojungle.co.jp/tools/indicators/11836
The PDF file includes 358 items (over 1,400 pages, over 470,000 characters).
Many of themexplain how to logically link higher and lower timeframes using three RCI lines to examine multiple lower-timeframe situations sequentially, ultimately waiting for dip-buy or rally-sell timing on lower timeframes (i.e., mBDSR signals)..
Additionally,there are many that emphasize pinpointing entry points where multiple entry justifications overlap..
Furthermore,there are methods that explore upside and downside targets using three RCI lines..
In the explanations within the PDF file,over 1,350 chartsare used.
× ![]()


