

Translate the following HTML to English, keep HTML format, do not use markdown code or line breaks, convert standard decode before translate: 押し安値割れとダブルトップとmBDSR(RCI2本フィルター)の戻り売りサイン Translation: Signal for selling on a pullback after breaking the nearby
【Mastering RCI!! Trend Reversal, Buy on Dips, Sell on Rallies】
Indicator with powerful performance when combined with RCI: 【BODSOR・mBDSR】
and Techniques & Case Studies (PDF) ★GogoJungle AWARD2020 Winner★
https://www.gogojungle.co.jp/tools/indicators/11836
NZDJPY - New Zealand Dollar / Japanese Yen, 5-minute chart
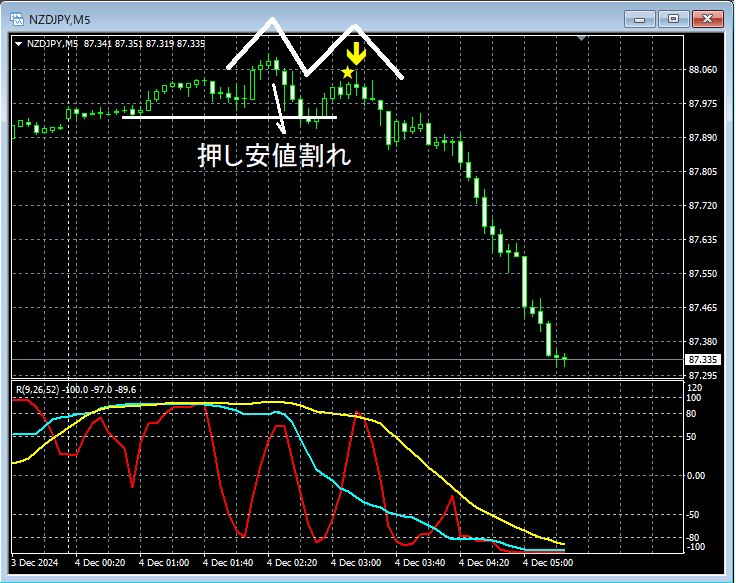
In the 5-minute chart above,the buyback signal after breaking the swing lowis lit by a rebound ofmBDSR (2-RCI filter)and subsequently the price drops sharply.
Moreover,the timing of the start of the decline at the right peak of the double topcan be well captured bythe rebound sell signal of mBDSR (2-RCI filter).
From this example,there is a strong compatibility between trading methods focusing on swing lows (Dow Theory) or double topsandthe signals of mBDSR.
Additionally, in this example, by placing the stop loss slightly above the recent high (the left peak of the double top)the trade can achieve a high risk-reward ratio.
※Note: In the charts introduced in this article, for ease of explanation, circles, lines, and rectangles may be drawn.
Indicator with powerful performance when combined with RCI: 【BODSOR・mBDSR】
and Techniques & Case Studies (PDF) ★GogoJungle AWARD2020 Winner★
https://www.gogojungle.co.jp/tools/indicators/11836
The PDF file includes 358 documents (over 1,400 pages, over 470,000 characters).
Many of them are summaries of cases where multiple lower-timeframe situations are logically linked by using three RCI lines to connect higher and lower timeframes, ultimately waiting for a dip buy or pullback sell timing (i.e., mBDSR signals) on the lower timeframe..
Also,many focus on identifying points where multiple entry reasons coincide..
Additionally,there are methods that explore potential upside or downside targets using three RCI lines..
In the PDF explanations,.

Indicator with powerful performance when combined with RCI: 【BODSOR・mBDSR】
and Techniques & Case Studies (PDF) ★GogoJungle AWARD2020 Winner★
https://www.gogojungle.co.jp/tools/indicators/11836
NZDJPY - New Zealand Dollar / Japanese Yen, 5-minute chart
In the 5-minute chart above,the buyback signal after breaking the swing lowis lit by a rebound ofmBDSR (2-RCI filter)and subsequently the price drops sharply.
Moreover,the timing of the start of the decline at the right peak of the double topcan be well captured bythe rebound sell signal of mBDSR (2-RCI filter).
From this example,there is a strong compatibility between trading methods focusing on swing lows (Dow Theory) or double topsandthe signals of mBDSR.
Additionally, in this example, by placing the stop loss slightly above the recent high (the left peak of the double top)the trade can achieve a high risk-reward ratio.
※Note: In the charts introduced in this article, for ease of explanation, circles, lines, and rectangles may be drawn.
Indicator with powerful performance when combined with RCI: 【BODSOR・mBDSR】
and Techniques & Case Studies (PDF) ★GogoJungle AWARD2020 Winner★
https://www.gogojungle.co.jp/tools/indicators/11836
The PDF file includes 358 documents (over 1,400 pages, over 470,000 characters).
Many of them are summaries of cases where multiple lower-timeframe situations are logically linked by using three RCI lines to connect higher and lower timeframes, ultimately waiting for a dip buy or pullback sell timing (i.e., mBDSR signals) on the lower timeframe..
Also,many focus on identifying points where multiple entry reasons coincide..
Additionally,there are methods that explore potential upside or downside targets using three RCI lines..
In the PDF explanations,.
× ![]()


