

Breakout of the previous high and break of the pullback low, and moving average line and mBDSR signal
0
【Mastering RCI!! Trend Reversals, Buy the Dip, Sell the Rally】
Indicator that shines when combined with RCI【BODSOR・mBDSR】
and methods・case studies (PDF) ★GogoJungle AWARD2020 winner★
https://www.gogojungle.co.jp/tools/indicators/11836
AUDJPY 5-minute chart
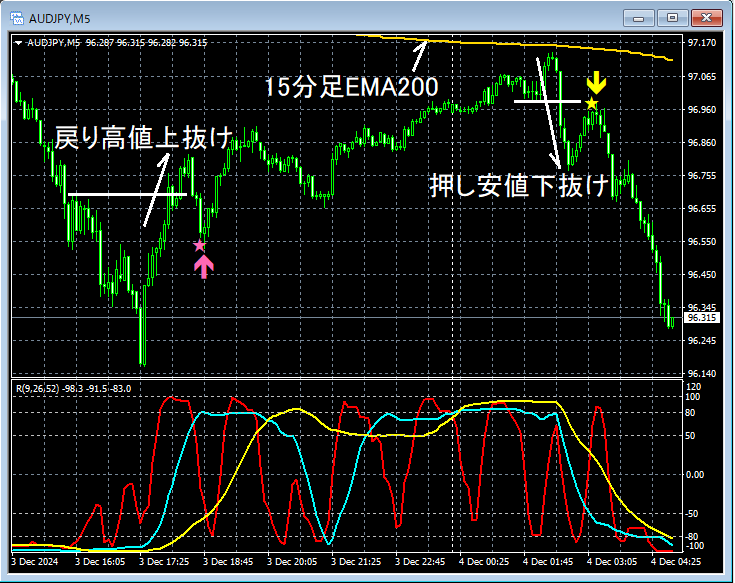
In the 5-minute chart above,the buy-the-dalliance signal after breaking above the swing highis lit by the mBDSR (RCI two-line filter) and the price clearly rises.
Then,around the EMA200 on the 15-minute chartrises and then pulls back.The rise after breaking below the swing lowis followed by the mBDSR return-sell signalThis indicates that the signals of mBDSR and a focus on retracements (or resistance/support) complement each other well.
From this example,a trading approach focusing on retracement highs (Dow Theory) and moving averagesand thesignals of mBDSRshow a high degree of compatibility.
※Note: In the charts referenced in this article, for convenience, circles, lines, and rectangles may be drawn; please understand this.
Indicator that shines when combined with RCI【BODSOR・mBDSR】
and methods・case studies (PDF) ★GogoJungle AWARD2020 winner★
https://www.gogojungle.co.jp/tools/indicators/11836
The PDF file includes 358 files (over 1,400 pages, over 470,000 characters).
Most of these areexamples that lay out a method of using the RCI three-line setup to logically link higher and lower timeframes, sequentially considering multiple lower timeframes, and ultimately waiting for the timing of buy-the-dip or sell-the-rally on the lower timeframe (i.e., the mBDSR signal)..
Also,many focus on identifying points where multiple entry reasons overlap..
Additionally,there are methods that explore ascent and descent targets using the RCI three-line setup..
In the PDF explanations,over 1,350 chartsare used.

Indicator that shines when combined with RCI【BODSOR・mBDSR】
and methods・case studies (PDF) ★GogoJungle AWARD2020 winner★
https://www.gogojungle.co.jp/tools/indicators/11836
AUDJPY 5-minute chart
In the 5-minute chart above,the buy-the-dalliance signal after breaking above the swing highis lit by the mBDSR (RCI two-line filter) and the price clearly rises.
Then,around the EMA200 on the 15-minute chartrises and then pulls back.The rise after breaking below the swing lowis followed by the mBDSR return-sell signalThis indicates that the signals of mBDSR and a focus on retracements (or resistance/support) complement each other well.
From this example,a trading approach focusing on retracement highs (Dow Theory) and moving averagesand thesignals of mBDSRshow a high degree of compatibility.
※Note: In the charts referenced in this article, for convenience, circles, lines, and rectangles may be drawn; please understand this.
Indicator that shines when combined with RCI【BODSOR・mBDSR】
and methods・case studies (PDF) ★GogoJungle AWARD2020 winner★
https://www.gogojungle.co.jp/tools/indicators/11836
The PDF file includes 358 files (over 1,400 pages, over 470,000 characters).
Most of these areexamples that lay out a method of using the RCI three-line setup to logically link higher and lower timeframes, sequentially considering multiple lower timeframes, and ultimately waiting for the timing of buy-the-dip or sell-the-rally on the lower timeframe (i.e., the mBDSR signal)..
Also,many focus on identifying points where multiple entry reasons overlap..
Additionally,there are methods that explore ascent and descent targets using the RCI three-line setup..
In the PDF explanations,over 1,350 chartsare used.
× ![]()


