

Pin Bar, Return High, and mBDSR (RCI two-filter) Buy Signal
【Mastering RCI!! Trend Reversals, Buy Dips, Sell Rallies】
Indicator 【BODSOR・mBDSR】 that shines in combination with RCI
Methods & Case Studies (PDF) ★GogoJungle AWARD2020 winner★
https://www.gogojungle.co.jp/tools/indicators/11836
New Zealand Dollar/Yen NZDJPY 1-hour chart
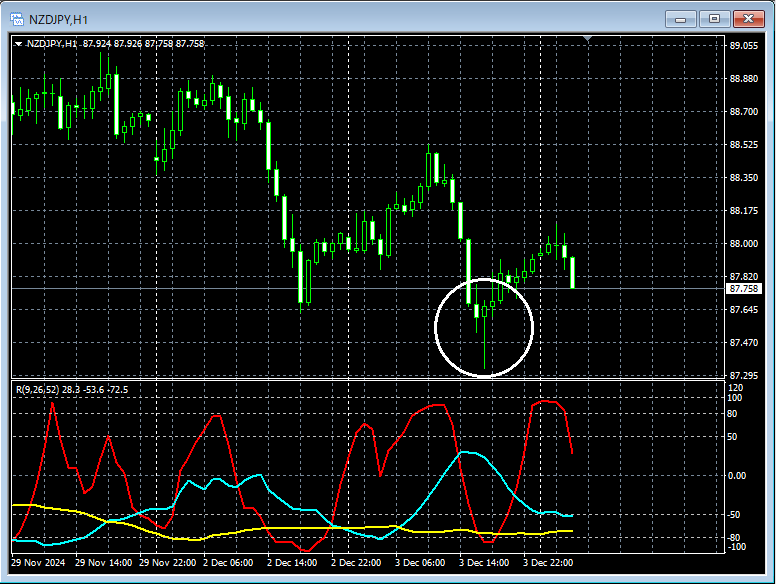
On the above 1-hour chart, looking at the area circled in white may suggest a potential trend reversalPin Bar (long lower shadow)appears. It might be a scene where considering a dip-buy on lower timeframes is not unusual.
New Zealand Dollar/Yen NZDJPY 5-minute chart
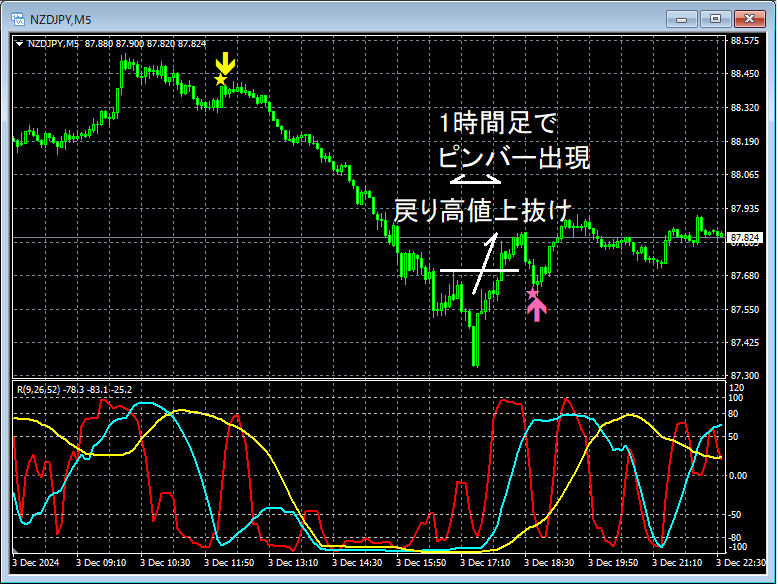
On the 5-minute chart above, there is a rebound from a downtrend. And on the 1-hour chartPin Barappears. ThenBreak above the swing highleads to a decline,mBDSR (Filter: RCI26 and RCI52) dip-buy signallights up and the price rises steadily.
From this example,a trading method that focuses on Pin Bars and swing highs (Dow Theory)andthe signal from mBDSRshow a high degree of compatibility.
※ Please note that in the charts introduced in this article, for convenience of explanation, circles, straight lines, and rectangles may have been added.
Indicator 【BODSOR・mBDSR】 that shines in combination with RCI
Methods & Case Studies (PDF) ★GogoJungle AWARD2020 winner★
https://www.gogojungle.co.jp/tools/indicators/11836
The PDF file includes 358 items (over 1,400 pages, over 470,000 words).
Most of them are summaries of examples that have broken down a process where, using the three-line RCI, higher and lower timeframes are logically linked to examine multiple lower-timeframe conditions in sequence, ultimately waiting for a dip-buy or rally-sell timing (the mBDSR signal) on the lower timeframe.
Additionally,many of them emphasize identifying points where multiple entry reasons converge..
Furthermore,there are also techniques that explore upward and downward targets using the three-line RCI..
In the explanation within the PDF files,more than 1,350 chartsare used.

Indicator 【BODSOR・mBDSR】 that shines in combination with RCI
Methods & Case Studies (PDF) ★GogoJungle AWARD2020 winner★
https://www.gogojungle.co.jp/tools/indicators/11836
New Zealand Dollar/Yen NZDJPY 1-hour chart
On the above 1-hour chart, looking at the area circled in white may suggest a potential trend reversalPin Bar (long lower shadow)appears. It might be a scene where considering a dip-buy on lower timeframes is not unusual.
New Zealand Dollar/Yen NZDJPY 5-minute chart
On the 5-minute chart above, there is a rebound from a downtrend. And on the 1-hour chartPin Barappears. ThenBreak above the swing highleads to a decline,mBDSR (Filter: RCI26 and RCI52) dip-buy signallights up and the price rises steadily.
From this example,a trading method that focuses on Pin Bars and swing highs (Dow Theory)andthe signal from mBDSRshow a high degree of compatibility.
※ Please note that in the charts introduced in this article, for convenience of explanation, circles, straight lines, and rectangles may have been added.
Indicator 【BODSOR・mBDSR】 that shines in combination with RCI
Methods & Case Studies (PDF) ★GogoJungle AWARD2020 winner★
https://www.gogojungle.co.jp/tools/indicators/11836
The PDF file includes 358 items (over 1,400 pages, over 470,000 words).
Most of them are summaries of examples that have broken down a process where, using the three-line RCI, higher and lower timeframes are logically linked to examine multiple lower-timeframe conditions in sequence, ultimately waiting for a dip-buy or rally-sell timing (the mBDSR signal) on the lower timeframe.
Additionally,many of them emphasize identifying points where multiple entry reasons converge..
Furthermore,there are also techniques that explore upward and downward targets using the three-line RCI..
In the explanation within the PDF files,more than 1,350 chartsare used.
× ![]()


