

RCI three-line and counter-trend line, support-resistance reversal, and mBDSR (RCI two-line filter) bearish signal
【Mastering RCI!! Trend Reversal, Buy on Dip, Sell on Rally】
Indicator that shines in combination with RCI: 【BODSOR・mBDSR】
Methods, case studies (PDF) ★GogoJungle AWARD2020 winner★
https://www.gogojungle.co.jp/tools/indicators/11836
GBPUSD 5-minute chart
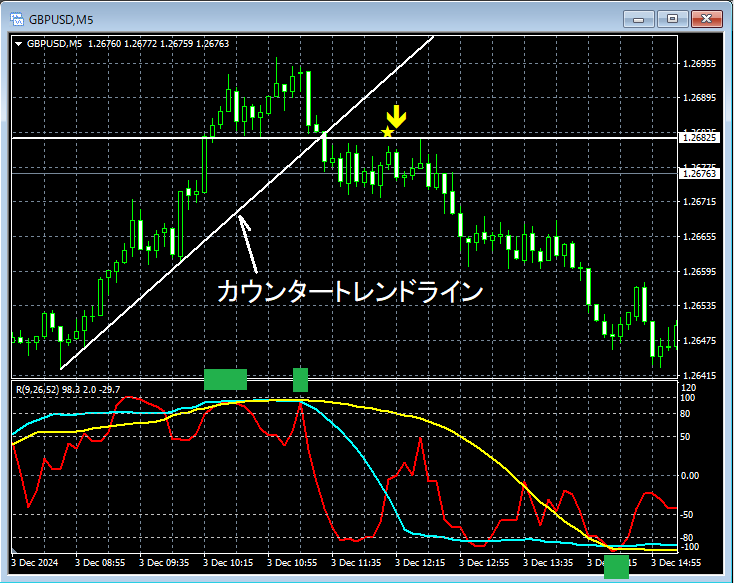
Looking at the 5-minute chart above, the form known asRCI triple toprose up to the green-square area and then reversed.Counter-trend linewas broken below. The price clearly moves down from thesupport-resistance reversalpattern. In the middle,mBDSR (RCI 2-line filter) sell-off signallights up at the right timing. And,RCI 3-lineisRCI triple bottomformed, having fallen to the green-square area.
From this example,a trading method focused on RCI 3-line, counter-trend line, and support-resistance reversalandthe signal from mBDSRshow high compatibility.
※Please note that in the charts mentioned in this article, for explanatory convenience, circles, straight lines, and squares may have been added.
Indicator that shines in combination with RCI: 【BODSOR・mBDSR】
Methods, case studies (PDF) ★GogoJungle AWARD2020 winner★
https://www.gogojungle.co.jp/tools/indicators/11836
The PDF file contains 358 items (over 1,400 pages, over 470,000 words).
Many of these are summaries of cases where upper and lower charts are logically linked using the RCI 3-line, systematically examining multiple lower-timeframe situations, and ultimately waiting for a dip-buy or pullback-sell timing (i.e., mBDSR signals) on the lower timeframes.
Additionally,many focus on pinpointing points where multiple entry reasons overlap.There are many such cases.
Moreover,there are methods that explore upper targets and downside targets using the RCI 3-line.Also included.
In the PDF explanations,more than 1,350 chartsare used.

Indicator that shines in combination with RCI: 【BODSOR・mBDSR】
Methods, case studies (PDF) ★GogoJungle AWARD2020 winner★
https://www.gogojungle.co.jp/tools/indicators/11836
GBPUSD 5-minute chart
Looking at the 5-minute chart above, the form known asRCI triple toprose up to the green-square area and then reversed.Counter-trend linewas broken below. The price clearly moves down from thesupport-resistance reversalpattern. In the middle,mBDSR (RCI 2-line filter) sell-off signallights up at the right timing. And,RCI 3-lineisRCI triple bottomformed, having fallen to the green-square area.
From this example,a trading method focused on RCI 3-line, counter-trend line, and support-resistance reversalandthe signal from mBDSRshow high compatibility.
※Please note that in the charts mentioned in this article, for explanatory convenience, circles, straight lines, and squares may have been added.
Indicator that shines in combination with RCI: 【BODSOR・mBDSR】
Methods, case studies (PDF) ★GogoJungle AWARD2020 winner★
https://www.gogojungle.co.jp/tools/indicators/11836
The PDF file contains 358 items (over 1,400 pages, over 470,000 words).
Many of these are summaries of cases where upper and lower charts are logically linked using the RCI 3-line, systematically examining multiple lower-timeframe situations, and ultimately waiting for a dip-buy or pullback-sell timing (i.e., mBDSR signals) on the lower timeframes.
Additionally,many focus on pinpointing points where multiple entry reasons overlap.There are many such cases.
Moreover,there are methods that explore upper targets and downside targets using the RCI 3-line.Also included.
In the PDF explanations,more than 1,350 chartsare used.
× ![]()


