

Haramizuashi (hammer pattern) with RCI three-line and mBDSR (RCI two-filter) pullback-buy signal
【Mastering RCI!! Trend Reversal, Buy on Dips, Sell on Rallies】
Indicator 【BODSOR・mBDSR】 that delivers power in combination with RCI
and methodology・case studies (PDF) ★GogoJungle AWARD2020 winner★
https://www.gogojungle.co.jp/tools/indicators/11836
GBP/JPY 1-hour chart
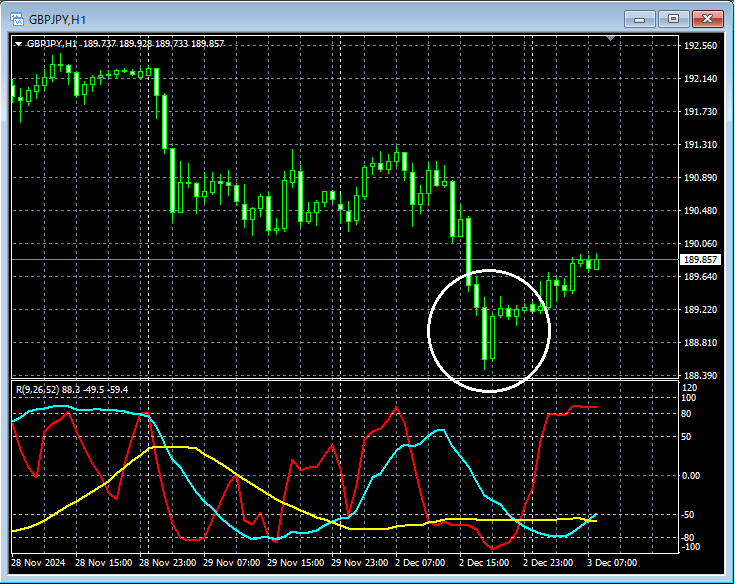
Looking at around the area circled in white on the above 1-hour chart suggests a potential trend reversalin a consolidationis appearing. It may not be strange to consider buying on dips on the lower time frames.
GBP/JPY 15-minute chart
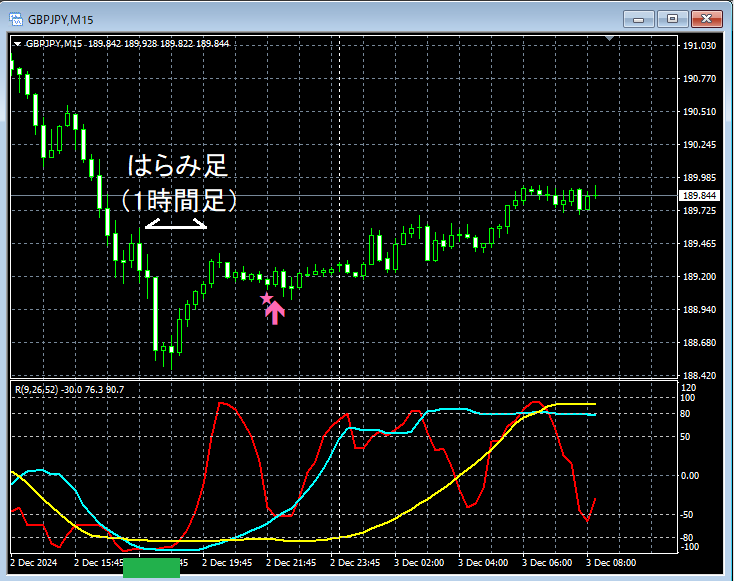
On the above 15-minute chart, the so-calledRCI triple bottomcollapsed to the green-box area, then rebounded. And on the 1-hour chartconsolidationappeared, after whichmBDSR (Filter: RCI26 and RCI52) Buy-the-dip signallights up and the price rises firmly.
From this example,a trading method focusing on the RCI three-line (three RCI lines) and consolidationandthe signals of mBDSRshow high compatibility.
※Please note that in the charts introduced in this article, for convenience of explanation, circles, lines, and rectangles may be drawn as additions.
Indicator 【BODSOR・mBDSR】 that delivers power in combination with RCI
and methodology・case studies (PDF) ★GogoJungle AWARD2020 winner★
https://www.gogojungle.co.jp/tools/indicators/11836
The PDF file is included with 358 items (over 1,400 pages, over 470,000 characters).
Most of them are summaries of examples that use RCI three-line to logically link higher and lower timeframes, examining multiple lower-timeframe conditions step by step, and ultimately waiting for dip-buy or rally-sell timing (i.e., mBDSR signals) on the lower timeframes.
Also,many entries focus on points where multiple entry reasons line up..
Additionally,there are methods that explore upside and downside targets using the RCI three-line..
In the PDF explanations,over 1,350 chartsare used.

Indicator 【BODSOR・mBDSR】 that delivers power in combination with RCI
and methodology・case studies (PDF) ★GogoJungle AWARD2020 winner★
https://www.gogojungle.co.jp/tools/indicators/11836
GBP/JPY 1-hour chart
Looking at around the area circled in white on the above 1-hour chart suggests a potential trend reversalin a consolidationis appearing. It may not be strange to consider buying on dips on the lower time frames.
GBP/JPY 15-minute chart
On the above 15-minute chart, the so-calledRCI triple bottomcollapsed to the green-box area, then rebounded. And on the 1-hour chartconsolidationappeared, after whichmBDSR (Filter: RCI26 and RCI52) Buy-the-dip signallights up and the price rises firmly.
From this example,a trading method focusing on the RCI three-line (three RCI lines) and consolidationandthe signals of mBDSRshow high compatibility.
※Please note that in the charts introduced in this article, for convenience of explanation, circles, lines, and rectangles may be drawn as additions.
Indicator 【BODSOR・mBDSR】 that delivers power in combination with RCI
and methodology・case studies (PDF) ★GogoJungle AWARD2020 winner★
https://www.gogojungle.co.jp/tools/indicators/11836
The PDF file is included with 358 items (over 1,400 pages, over 470,000 characters).
Most of them are summaries of examples that use RCI three-line to logically link higher and lower timeframes, examining multiple lower-timeframe conditions step by step, and ultimately waiting for dip-buy or rally-sell timing (i.e., mBDSR signals) on the lower timeframes.
Also,many entries focus on points where multiple entry reasons line up..
Additionally,there are methods that explore upside and downside targets using the RCI three-line..
In the PDF explanations,over 1,350 chartsare used.
× ![]()


