

Hammering on RSI and Sakata's Five Methods (Morning Star) and RCI three-line and mBDSR pullback buying signal
【Mastering RCI!! Trend Reversal, Buy on Dips, Sell on Rallies】
Indicator【BODSOR・mBDSR】that powers up when used in combination with RCI
Methods and Case Studies (PDF) ★GogoJungle AWARD2020 Winner★
https://www.gogojungle.co.jp/tools/indicators/11836
EUR/JPY 1-hour chart
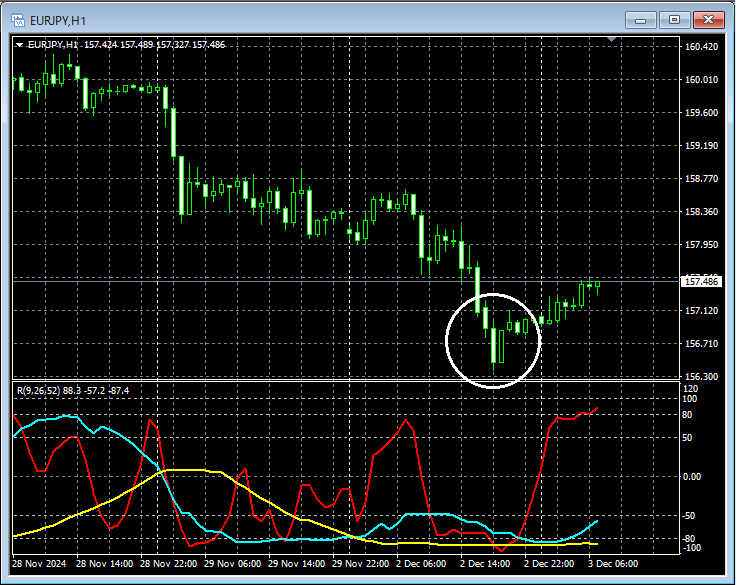
Looking at the area circled in white on the 1-hour chart above, it suggests a potential trend reversalPullbackappears. It may not be unusual to consider buying on dips on lower timeframes.
EUR/JPY 30-minute chart
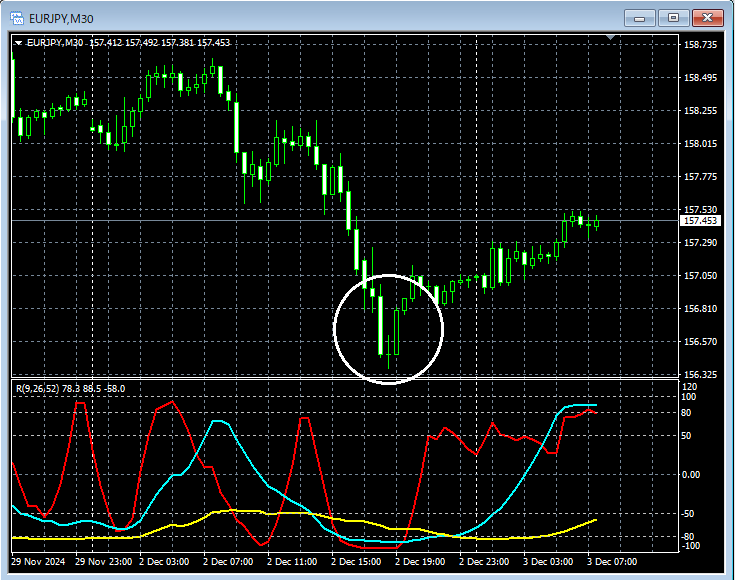
The upper 30-minute chart suggests a potential reversal from a downtrend to an uptrendSakata Fifth Method “Morning Star”appears. It may not be unusual to consider buying on dips on lower timeframes.
EUR/JPY 15-minute chart
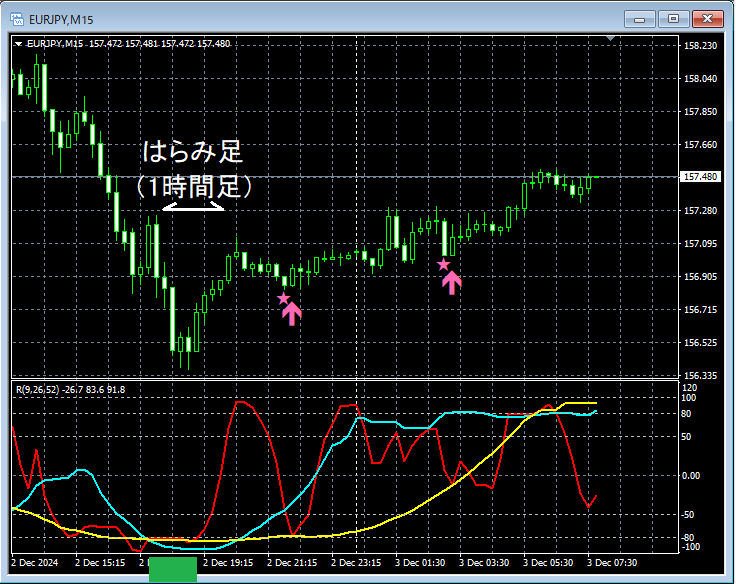
On the upper 15-minute chart, the so-calledRCI Triple Bottom fell to roughly the green square area, then rebounded. And on the 1-hour chart,Pullbackappeared,mBDSR (Filter: RCI26 and RCI52) Buy-the-Dip signallit up twice and the price rose steadily.
From this example,a trading method focusing on the RCI three-line, pullback patterns, and Sakata Fifth Method “Morning Star”andthe signal of mBDSRshow a high degree of compatibility.
※ Please note that in the charts introduced in this article, for convenience of explanation, circles, lines, and rectangles may be drawn.
Indicator【BODSOR・mBDSR】that powers up when used in combination with RCI
Methods and Case Studies (PDF) ★GogoJungle AWARD2020 Winner★
https://www.gogojungle.co.jp/tools/indicators/11836
The PDF file includes 358 documents (over 1,400 pages, over 470,000 words in total).
Most of them are organized as examples that use the RCI three-line to logically link higher and lower timeframes, sequentially examine the conditions of multiple lower timeframes, and ultimately wait for the timing of dips or rallies on the lower timeframes (i.e., the mBDSR signals).
Also,many emphasize capturing points where multiple entry reasons overlap.There are also many examples.
Additionally,there are methods that explore upside targets and downside targets using the RCI three-line.Also included.
In the PDF explanations,more than 1,350 chartsare used.

Indicator【BODSOR・mBDSR】that powers up when used in combination with RCI
Methods and Case Studies (PDF) ★GogoJungle AWARD2020 Winner★
https://www.gogojungle.co.jp/tools/indicators/11836
EUR/JPY 1-hour chart
Looking at the area circled in white on the 1-hour chart above, it suggests a potential trend reversalPullbackappears. It may not be unusual to consider buying on dips on lower timeframes.
EUR/JPY 30-minute chart
The upper 30-minute chart suggests a potential reversal from a downtrend to an uptrendSakata Fifth Method “Morning Star”appears. It may not be unusual to consider buying on dips on lower timeframes.
EUR/JPY 15-minute chart
On the upper 15-minute chart, the so-calledRCI Triple Bottom fell to roughly the green square area, then rebounded. And on the 1-hour chart,Pullbackappeared,mBDSR (Filter: RCI26 and RCI52) Buy-the-Dip signallit up twice and the price rose steadily.
From this example,a trading method focusing on the RCI three-line, pullback patterns, and Sakata Fifth Method “Morning Star”andthe signal of mBDSRshow a high degree of compatibility.
※ Please note that in the charts introduced in this article, for convenience of explanation, circles, lines, and rectangles may be drawn.
Indicator【BODSOR・mBDSR】that powers up when used in combination with RCI
Methods and Case Studies (PDF) ★GogoJungle AWARD2020 Winner★
https://www.gogojungle.co.jp/tools/indicators/11836
The PDF file includes 358 documents (over 1,400 pages, over 470,000 words in total).
Most of them are organized as examples that use the RCI three-line to logically link higher and lower timeframes, sequentially examine the conditions of multiple lower timeframes, and ultimately wait for the timing of dips or rallies on the lower timeframes (i.e., the mBDSR signals).
Also,many emphasize capturing points where multiple entry reasons overlap.There are also many examples.
Additionally,there are methods that explore upside targets and downside targets using the RCI three-line.Also included.
In the PDF explanations,more than 1,350 chartsare used.
× ![]()


