

【Capture the market bottom and reversal!!】RCI three-line, counter-trend line, double bottom, and mBDSR (RCI two-line filter) pullback buying signal
0
【Mastering RCI!! Trend Reversal, Buying Dips, Selling on Retracements】
Indicator that shines when combined with RCI【BODSOR · mBDSR】
and methods, case studies (PDF) ★GogoJungle AWARD2020 winner★
https://www.gogojungle.co.jp/tools/indicators/11836
New Zealand Dollar / U.S. Dollar 5-minute chart
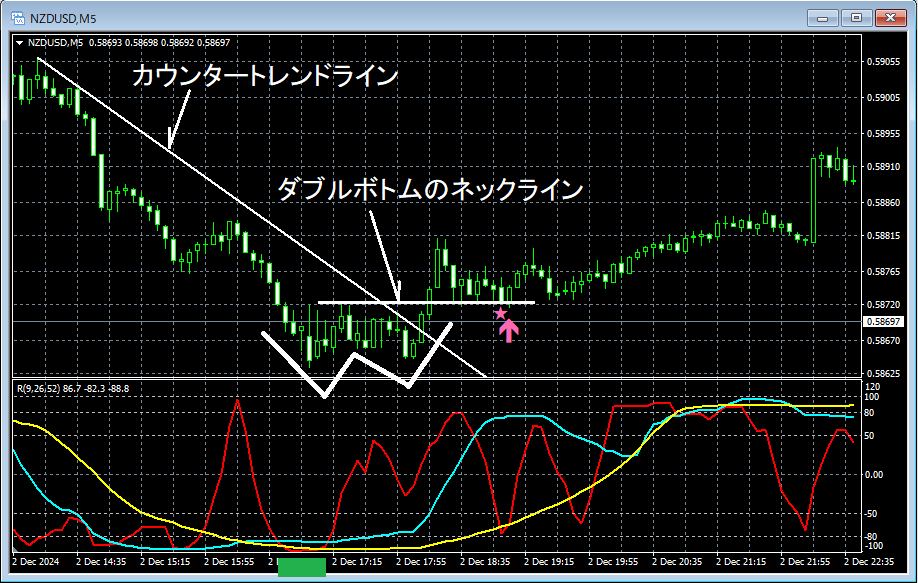
Looking at the 5-minute chart above, the price has dropped to the so-calledRCI triple bottomshape (around the green square) and then reversed.Counter-trend linewas broken above,neckline of the double bottomwas broken above. Then, near theneckline of the double bottomarea,mBDSR’s (RCI two-line filter) dip-buy signallighted up, and subsequently, price rose firmly.
Double bottomandbreak above the counter-trend line (downward trend line)are sometimes viewed as chart patterns signaling a trend reversal from down to up, but from this example,the high synergy between trading methods focusing on RCI three lines, double bottom, and counter-trend lineandmBDSR signalsis evident.
※Please note that in the charts referenced in this article, for convenience, circles, straight lines, and squares may have been drawn.
Indicator that shines when combined with RCI【BODSOR · mBDSR】
and methods, case studies (PDF) ★GogoJungle AWARD2020 winner★
https://www.gogojungle.co.jp/tools/indicators/11836
The PDF file contains 358 items (over 1,400 pages, over 470,000 characters).
Most of them are summaries of examples that logically link higher and lower timeframes using three-line RCI, sequentially examining multiple lower timeframes, and ultimately waiting for a dip-buy or retrace-sell timing (i.e., an mBDSR signal) on the lower timeframe.
Additionally,many focus on capturing points where multiple entry reasons coincide..
Also included is a method for exploring upside and downside targets using the RCI three lines.
In the PDF explanations,over 1,350 chartsare used.

Indicator that shines when combined with RCI【BODSOR · mBDSR】
and methods, case studies (PDF) ★GogoJungle AWARD2020 winner★
https://www.gogojungle.co.jp/tools/indicators/11836
New Zealand Dollar / U.S. Dollar 5-minute chart
Looking at the 5-minute chart above, the price has dropped to the so-calledRCI triple bottomshape (around the green square) and then reversed.Counter-trend linewas broken above,neckline of the double bottomwas broken above. Then, near theneckline of the double bottomarea,mBDSR’s (RCI two-line filter) dip-buy signallighted up, and subsequently, price rose firmly.
Double bottomandbreak above the counter-trend line (downward trend line)are sometimes viewed as chart patterns signaling a trend reversal from down to up, but from this example,the high synergy between trading methods focusing on RCI three lines, double bottom, and counter-trend lineandmBDSR signalsis evident.
※Please note that in the charts referenced in this article, for convenience, circles, straight lines, and squares may have been drawn.
Indicator that shines when combined with RCI【BODSOR · mBDSR】
and methods, case studies (PDF) ★GogoJungle AWARD2020 winner★
https://www.gogojungle.co.jp/tools/indicators/11836
The PDF file contains 358 items (over 1,400 pages, over 470,000 characters).
Most of them are summaries of examples that logically link higher and lower timeframes using three-line RCI, sequentially examining multiple lower timeframes, and ultimately waiting for a dip-buy or retrace-sell timing (i.e., an mBDSR signal) on the lower timeframe.
Additionally,many focus on capturing points where multiple entry reasons coincide..
Also included is a method for exploring upside and downside targets using the RCI three lines.
In the PDF explanations,over 1,350 chartsare used.
× ![]()


