

【Gold XAUUSD】Double top, mbDSR (RCI with 2 lines filter), and R1R2S2 pullback sell signal
0
【Mastering RCI!! Trend reversal, pullback buying, and pullback selling】
Indicator that shines in combination with RCI: 【BODSOR・mBDSR】
and methods, case studies (PDF) ★GogoJungle AWARD2020 winner★
https://www.gogojungle.co.jp/tools/indicators/11836
R1R2S2 is included in the above product. For details, please see the article below in Investment Navigator+.
RCI trio 'two-step decision' Release!! Indicator “R1R2S2” to target trend reversal, pullback buying, and pullback selling
Gold XAUUSD 30-minute chart
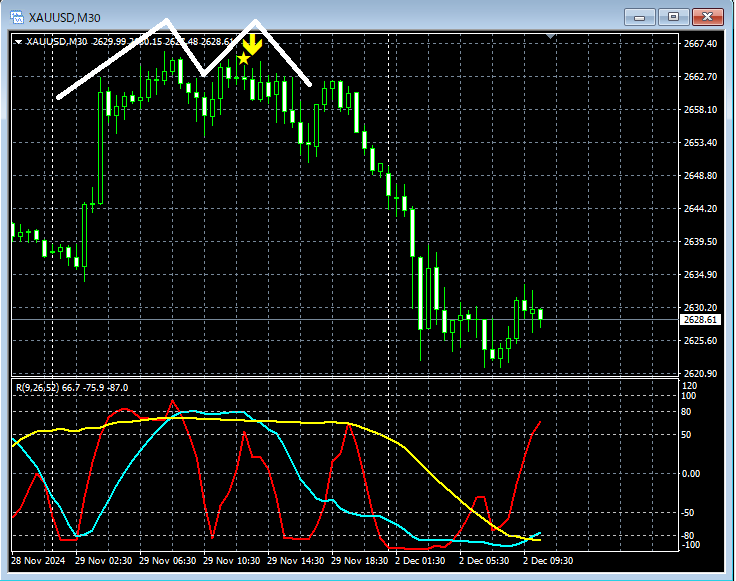
On the 30-minute chart above,the timing of the start of the decline at the right peak of the double topis effectively captured bythe return-selling signal of mBDSR (two RCI filters).
Here, we will also look at the lower timeframe, the 15-minute chart.
Gold XAUUSD 15-minute chart
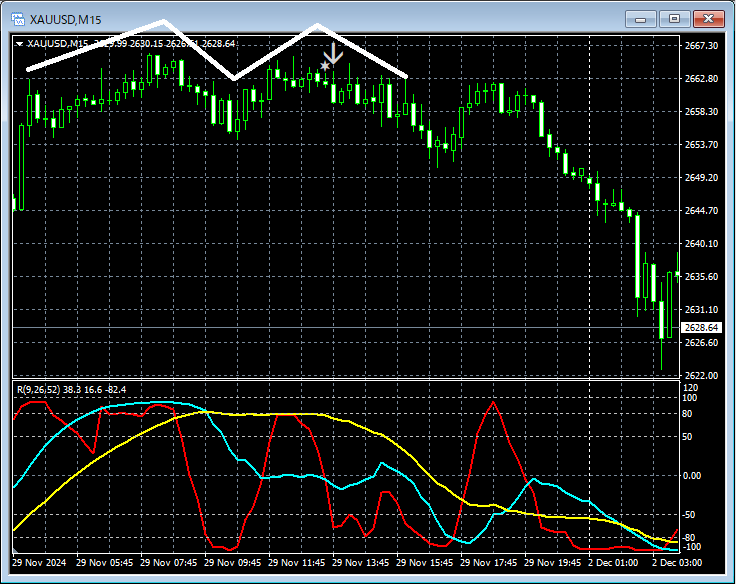
On the 15-minute chart above,the timing of the start of the decline at the right peak of the double topis well captured bythe pullback-selling signal of R1R2S2.
From this example,a trading method focusing on the double topandthe high compatibility with signals from mBDSR and R1R2S2is evident.
Also, in this example, by placing the stop-loss slightly above the recent high (left peak of the double top)you can achieve a high reward-to-risk trade.
※Note: In the charts introduced in this article, for ease of explanation, circles, lines, and rectangles may be drawn.
Indicator that shines in combination with RCI【BODSOR・mBDSR】
and methods, case studies (PDF) ★GogoJungle AWARD2020 winner★
https://www.gogojungle.co.jp/tools/indicators/11836
The PDF file includes 358 items (over 1,400 pages, over 470,000 characters in total).
Many of them are a collection of examples where the logic links the higher and lower timeframes using three RCI lines, ultimately waiting for pullback buying or pullback selling timing on the lower timeframe (i.e., signals from mBDSR).
Also,there are many that focus on identifying points where multiple entry rationale overlap..
In addition,it also includes methods to explore upward and downward targets using the three-RCI-line approach..
In the PDF explanations,more than 1,350 chartsare used.

Indicator that shines in combination with RCI: 【BODSOR・mBDSR】
and methods, case studies (PDF) ★GogoJungle AWARD2020 winner★
https://www.gogojungle.co.jp/tools/indicators/11836
R1R2S2 is included in the above product. For details, please see the article below in Investment Navigator+.
RCI trio 'two-step decision' Release!! Indicator “R1R2S2” to target trend reversal, pullback buying, and pullback selling
Gold XAUUSD 30-minute chart
On the 30-minute chart above,the timing of the start of the decline at the right peak of the double topis effectively captured bythe return-selling signal of mBDSR (two RCI filters).
Here, we will also look at the lower timeframe, the 15-minute chart.
Gold XAUUSD 15-minute chart
On the 15-minute chart above,the timing of the start of the decline at the right peak of the double topis well captured bythe pullback-selling signal of R1R2S2.
From this example,a trading method focusing on the double topandthe high compatibility with signals from mBDSR and R1R2S2is evident.
Also, in this example, by placing the stop-loss slightly above the recent high (left peak of the double top)you can achieve a high reward-to-risk trade.
※Note: In the charts introduced in this article, for ease of explanation, circles, lines, and rectangles may be drawn.
Indicator that shines in combination with RCI【BODSOR・mBDSR】
and methods, case studies (PDF) ★GogoJungle AWARD2020 winner★
https://www.gogojungle.co.jp/tools/indicators/11836
The PDF file includes 358 items (over 1,400 pages, over 470,000 characters in total).
Many of them are a collection of examples where the logic links the higher and lower timeframes using three RCI lines, ultimately waiting for pullback buying or pullback selling timing on the lower timeframe (i.e., signals from mBDSR).
Also,there are many that focus on identifying points where multiple entry rationale overlap..
In addition,it also includes methods to explore upward and downward targets using the three-RCI-line approach..
In the PDF explanations,more than 1,350 chartsare used.
× ![]()


