

【Today 2024.12.02 Swiss Franc to Yen】Break above the return high and pullback buying signal of mBDSR (RCI 2-period filter)
0
【 Mastering RCI!! Trend Reversal, Buy on Dips, Sell on Rallies 】
Indicator 【BODSOR・mBDSR】 that shines in combination with RCI
and methods・case studies (PDF) ★GogoJungle AWARD2020 winner★
https://www.gogojungle.co.jp/tools/indicators/11836
Swiss Franc Yen CHFJPY 5-minute chart
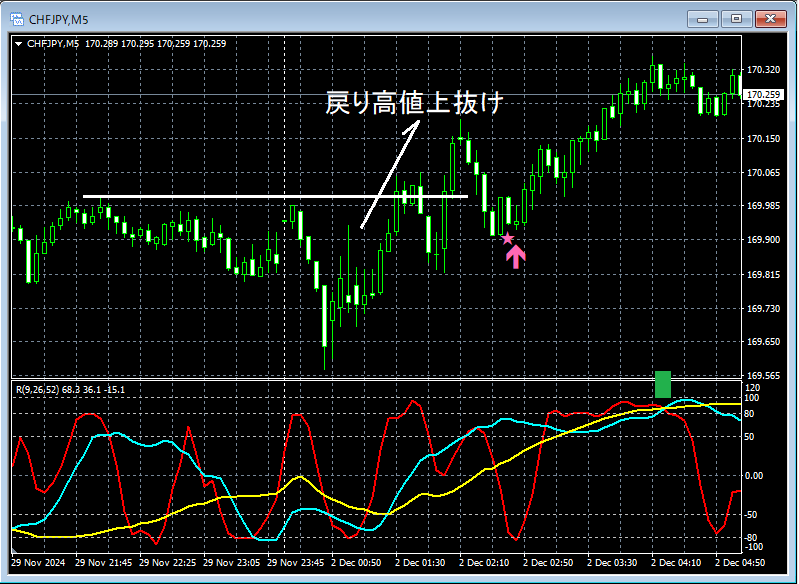
The status of the higher timeframe is omitted. Also,the method of applying RCI from the higher timeframe to the lower timeframe and waiting for the mBDSR signal on the lower timeframeis explained in detail in the accompanying PDF, so it is omitted here as well.
In this article, only the 5-minute chart is used for explanation, but in actual trading, when formulating a strategy,understanding the higher timeframe statusanddrilling down from higher to lower timeframes using RCIis extremely important.
On the upper 5-minute chart,a breakout above the retracement highis followed by a decline wherethe mBDSR buy-the-dip signal (RCI two-filter)lights up, and subsequently, price rises firmly.(drilling down from higher to lower timeframes using RCIis done to view the 5-minute chart, not vice versa.)
And,the shape of the RCI three-lineshows the so-calledRCI triple-top(around the green square). Also,the accompanying PDF explains a method to infer the potential rise using the behavior of the three RCI lines.
From this example, one can see the high compatibility betweena Dow Theory-based trading methodandthe mBDSR signals.
※Please note that for readability, the charts in this article may include added circles, lines, and squares.
Indicator 【BODSOR・mBDSR】 that shines in combination with RCI
and methods・case studies (PDF) ★GogoJungle AWARD2020 winner★
https://www.gogojungle.co.jp/tools/indicators/11836
The PDF file is attached with 358 items (over 1,400 pages, over 470,000 characters).
Most of them areexamples that lay out the process of linking higher and lower timeframes logically using the three-line RCI, progressively analyzing multiple lower-timeframe conditions, and ultimately waiting for the timing of buy on dips or sell on rallies on the lower timeframe (i.e., the mBDSR signal)..
Also,many resources emphasize identifying points where multiple entry justifications converge..
Additionally,there are methods to explore upon rising or falling targets using three-line RCI..
In the PDF explanations,more than 1,350 chartsare used.

Indicator 【BODSOR・mBDSR】 that shines in combination with RCI
and methods・case studies (PDF) ★GogoJungle AWARD2020 winner★
https://www.gogojungle.co.jp/tools/indicators/11836
Swiss Franc Yen CHFJPY 5-minute chart
The status of the higher timeframe is omitted. Also,the method of applying RCI from the higher timeframe to the lower timeframe and waiting for the mBDSR signal on the lower timeframeis explained in detail in the accompanying PDF, so it is omitted here as well.
In this article, only the 5-minute chart is used for explanation, but in actual trading, when formulating a strategy,understanding the higher timeframe statusanddrilling down from higher to lower timeframes using RCIis extremely important.
On the upper 5-minute chart,a breakout above the retracement highis followed by a decline wherethe mBDSR buy-the-dip signal (RCI two-filter)lights up, and subsequently, price rises firmly.(drilling down from higher to lower timeframes using RCIis done to view the 5-minute chart, not vice versa.)
And,the shape of the RCI three-lineshows the so-calledRCI triple-top(around the green square). Also,the accompanying PDF explains a method to infer the potential rise using the behavior of the three RCI lines.
From this example, one can see the high compatibility betweena Dow Theory-based trading methodandthe mBDSR signals.
※Please note that for readability, the charts in this article may include added circles, lines, and squares.
Indicator 【BODSOR・mBDSR】 that shines in combination with RCI
and methods・case studies (PDF) ★GogoJungle AWARD2020 winner★
https://www.gogojungle.co.jp/tools/indicators/11836
The PDF file is attached with 358 items (over 1,400 pages, over 470,000 characters).
Most of them areexamples that lay out the process of linking higher and lower timeframes logically using the three-line RCI, progressively analyzing multiple lower-timeframe conditions, and ultimately waiting for the timing of buy on dips or sell on rallies on the lower timeframe (i.e., the mBDSR signal)..
Also,many resources emphasize identifying points where multiple entry justifications converge..
Additionally,there are methods to explore upon rising or falling targets using three-line RCI..
In the PDF explanations,more than 1,350 chartsare used.
× ![]()


