

【Today 2024/12/02 Dollar/Yen mbDSR (Moving Average Smoothing Filter) Buy Signal】Also pay attention to the Moving Average (EMA200)
【Mastering RCI!! Trend Reversal, Buy the Dip, Sell the Rally】
Indicator【BODSOR・mBDSR】that shines in combination with RCI
Methods・Case Studies (PDF) ★GogoJungle AWARD2020 Winner★
https://www.gogojungle.co.jp/tools/indicators/11836
mBDSR (RCI Filter)andmBDSR (Moving Average Filter)have different roles. The PDF above also touches on how to use these appropriately.
Below,mBDSR (Moving Average Filter)signs will be introduced as examples.
USDJPY – US Dollar vs Japanese Yen, 5-minute chart
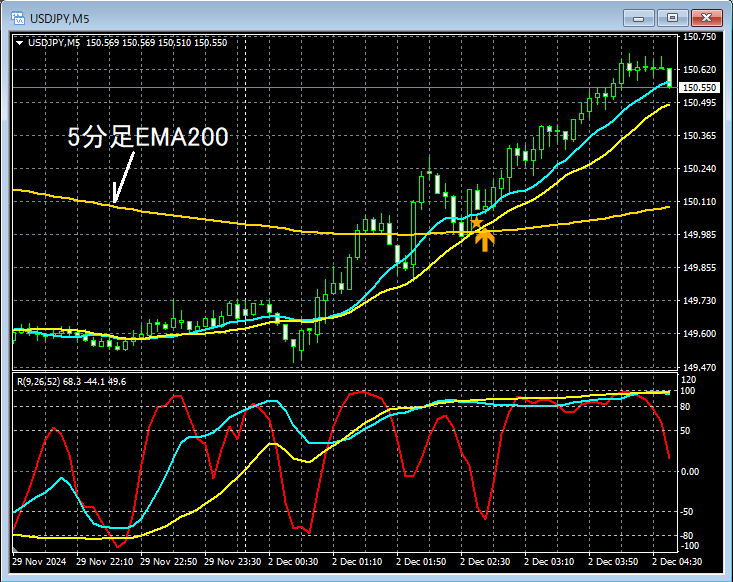
On the above 5-minute chart,EMA200clearly breaks above, and thenEMA200pulls back near that levelmBDSR (Moving Average Filter) Buy-the-Dip signallights up, and subsequently the price rises firmly.
From this example,a trading method focused on moving averagesthe signals of mBDSRappear to be highly compatible.
※Please note that charts mentioned in this article may include added circles, lines, or rectangles for explanatory convenience.
Indicator【BODSOR・mBDSR】that shines in combination with RCI
Methods・Case Studies (PDF) ★GogoJungle AWARD2020 Winner★
https://www.gogojungle.co.jp/tools/indicators/11836
The PDF file includes 358 items (over 1,400 pages, over 470,000 characters).
Many of these areexamples that logically link higher and lower timeframes using the RCI triple-line, sequentially examining multiple lower timeframes, and ultimately waiting for the dip-buying or pullback timing (i.e., mBDSR signals) on the lower timeframe..
Additionally,there are many that focus on capturing points where multiple entry reasons align..
Furthermore,there are methods that explore upward and downward targets using the RCI triple-line..
In the PDF explanation,more than 1,350 chartsare used.

Indicator【BODSOR・mBDSR】that shines in combination with RCI
Methods・Case Studies (PDF) ★GogoJungle AWARD2020 Winner★
https://www.gogojungle.co.jp/tools/indicators/11836
mBDSR (RCI Filter)andmBDSR (Moving Average Filter)have different roles. The PDF above also touches on how to use these appropriately.
Below,mBDSR (Moving Average Filter)signs will be introduced as examples.
USDJPY – US Dollar vs Japanese Yen, 5-minute chart
On the above 5-minute chart,EMA200clearly breaks above, and thenEMA200pulls back near that levelmBDSR (Moving Average Filter) Buy-the-Dip signallights up, and subsequently the price rises firmly.
From this example,a trading method focused on moving averagesthe signals of mBDSRappear to be highly compatible.
※Please note that charts mentioned in this article may include added circles, lines, or rectangles for explanatory convenience.
Indicator【BODSOR・mBDSR】that shines in combination with RCI
Methods・Case Studies (PDF) ★GogoJungle AWARD2020 Winner★
https://www.gogojungle.co.jp/tools/indicators/11836
The PDF file includes 358 items (over 1,400 pages, over 470,000 characters).
Many of these areexamples that logically link higher and lower timeframes using the RCI triple-line, sequentially examining multiple lower timeframes, and ultimately waiting for the dip-buying or pullback timing (i.e., mBDSR signals) on the lower timeframe..
Additionally,there are many that focus on capturing points where multiple entry reasons align..
Furthermore,there are methods that explore upward and downward targets using the RCI triple-line..
In the PDF explanation,more than 1,350 chartsare used.
× ![]()


