

[From last week's chart -3] RCI three-line setup, downscaling from higher time frame to lower time frame, bullish price action, support, moving average, and mBDSR signal
0
【Mastering RCI!! Trend Reversal, Buy on Dips, Sell on Rallies】
Indicator that shines in combination with RCI: 【BODSOR・mBDSR】
Methods and Case Studies (PDF) ★GogoJungle AWARD2020 Winner★
https://www.gogojungle.co.jp/tools/indicators/11836
EURJPY, 4-hour chart
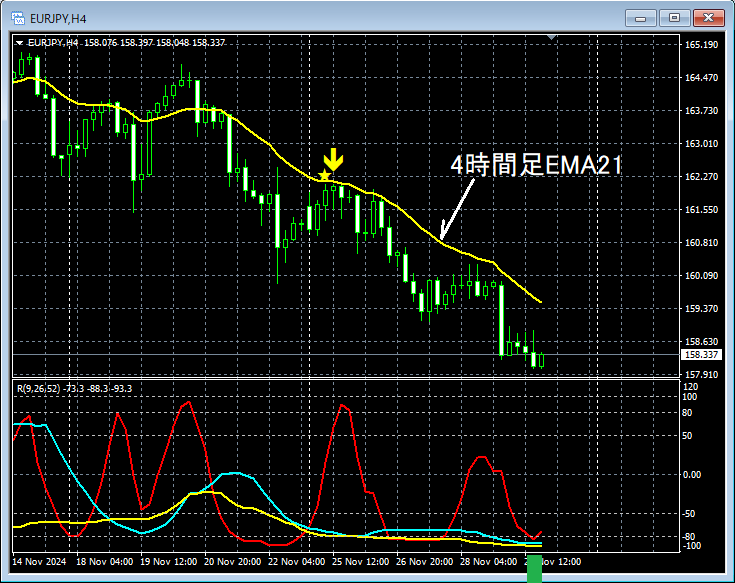
Details about the higher timeframe are omitted. Also,a method to drill down from higher timeframe to lower timeframe using RCI and wait for mBDSR signals on the lower timeframeis explained in detail in the accompanying PDF, which will also be omitted here.
In this article, only the 4-hour chart is used for explanation, but in actual trading, when forming a plan,understanding the higher timeframeanddrilling down from higher to lower timeframe using RCIare extremely important.
On the upper 4-hour chart (the lower timeframe in this example), what is considered important in this case isthe 4-hour EMA21nearbythe mBDSR (RCI two-filter) sell signallighting up, with price clearly moving down. (As a result of drilling down from higher to lower timeframe using RCI, we are looking at the 4-hour chart, not just randomly watching the 4-hour chart.)And,the RCI three-line shapeis, so to speak,RCI Triple Bottom(around the green square area)can be seen. Also,the PDF explains a method for estimating the downside target from the RCI three-line behavior. From this example,the high synergy between trading methods focusing on the RCI three lines, rising support (Dow Theory), and moving averagesandthe signals of mBDSRis evident.※Please note that for convenience, charts shown in this article may include drawn circles, lines, and rectangles.Indicator that shines in combination with RCI: 【BODSOR・mBDSR】Methods and Case Studies (PDF) ★GogoJungle AWARD2020 Winner★https://www.gogojungle.co.jp/tools/indicators/11836The PDF file contains 358 files (over 1,400 pages, over 470,000 Chinese characters).*Most of them are compiled as examples that link multiple higher and lower timeframes logically using the RCI three-line method, eventually modeling the timing of entering on a dip or waiting for a pullback on the lower timeframe via the mBDSR signals.Additionally,many are focused on catching points where multiple entry reasons coincide.Also included are those that explore rising or falling targets using the RCI three-line method.In the PDF explanations,more than 1,350 chartsare used.
And,the RCI three-line shapeis, so to speak,RCI Triple Bottom(around the green square area)the PDF explains a method for estimating the downside target from the RCI three-line behavior.
From this example,the high synergy between trading methods focusing on the RCI three lines, rising support (Dow Theory), and moving averagesandthe signals of mBDSRis evident.
※Please note that for convenience, charts shown in this article may include drawn circles, lines, and rectangles.
Indicator that shines in combination with RCI: 【BODSOR・mBDSR】
Methods and Case Studies (PDF) ★GogoJungle AWARD2020 Winner★
https://www.gogojungle.co.jp/tools/indicators/11836
The PDF file contains 358 files (over 1,400 pages, over 470,000 Chinese characters).*
Most of them are compiled as examples that link multiple higher and lower timeframes logically using the RCI three-line method, eventually modeling the timing of entering on a dip or waiting for a pullback on the lower timeframe via the mBDSR signals.
Additionally,many are focused on catching points where multiple entry reasons coincide.Also included are those that explore rising or falling targets using the RCI three-line method.
In the PDF explanations,
are used.

Indicator that shines in combination with RCI: 【BODSOR・mBDSR】
Methods and Case Studies (PDF) ★GogoJungle AWARD2020 Winner★
https://www.gogojungle.co.jp/tools/indicators/11836
EURJPY, 4-hour chart
Details about the higher timeframe are omitted. Also,a method to drill down from higher timeframe to lower timeframe using RCI and wait for mBDSR signals on the lower timeframeis explained in detail in the accompanying PDF, which will also be omitted here.
In this article, only the 4-hour chart is used for explanation, but in actual trading, when forming a plan,understanding the higher timeframeanddrilling down from higher to lower timeframe using RCIare extremely important.
On the upper 4-hour chart (the lower timeframe in this example), what is considered important in this case isthe 4-hour EMA21nearbythe mBDSR (RCI two-filter) sell signallighting up, with price clearly moving down. (As a result of drilling down from higher to lower timeframe using RCI, we are looking at the 4-hour chart, not just randomly watching the 4-hour chart.)And,the RCI three-line shapeis, so to speak,RCI Triple Bottom(around the green square area)can be seen. Also,the PDF explains a method for estimating the downside target from the RCI three-line behavior. From this example,the high synergy between trading methods focusing on the RCI three lines, rising support (Dow Theory), and moving averagesandthe signals of mBDSRis evident.※Please note that for convenience, charts shown in this article may include drawn circles, lines, and rectangles.Indicator that shines in combination with RCI: 【BODSOR・mBDSR】Methods and Case Studies (PDF) ★GogoJungle AWARD2020 Winner★https://www.gogojungle.co.jp/tools/indicators/11836The PDF file contains 358 files (over 1,400 pages, over 470,000 Chinese characters).*Most of them are compiled as examples that link multiple higher and lower timeframes logically using the RCI three-line method, eventually modeling the timing of entering on a dip or waiting for a pullback on the lower timeframe via the mBDSR signals.Additionally,many are focused on catching points where multiple entry reasons coincide.Also included are those that explore rising or falling targets using the RCI three-line method.In the PDF explanations,more than 1,350 chartsare used.
And,the RCI three-line shapeis, so to speak,RCI Triple Bottom(around the green square area)the PDF explains a method for estimating the downside target from the RCI three-line behavior.
From this example,the high synergy between trading methods focusing on the RCI three lines, rising support (Dow Theory), and moving averagesandthe signals of mBDSRis evident.
※Please note that for convenience, charts shown in this article may include drawn circles, lines, and rectangles.
Indicator that shines in combination with RCI: 【BODSOR・mBDSR】
Methods and Case Studies (PDF) ★GogoJungle AWARD2020 Winner★
https://www.gogojungle.co.jp/tools/indicators/11836
The PDF file contains 358 files (over 1,400 pages, over 470,000 Chinese characters).*
Most of them are compiled as examples that link multiple higher and lower timeframes logically using the RCI three-line method, eventually modeling the timing of entering on a dip or waiting for a pullback on the lower timeframe via the mBDSR signals.
Additionally,many are focused on catching points where multiple entry reasons coincide.Also included are those that explore rising or falling targets using the RCI three-line method.
In the PDF explanations,
are used.
× ![]()


