

[From last week's chart -2] RCI three-line setup, downscaling from higher to lower timeframes, bullish push low, moving average line, and mBDSR signal
0
【Mastering RCI!! Trend Reversal, Buy the Dip, Sell the Rally】
Indicator【BODSOR・mBDSR】that shines when used in combination with RCI
and methodology, case studies (PDF) ★GogoJungle AWARD2020 winner★
https://www.gogojungle.co.jp/tools/indicators/11836
Swiss Franc / Yen CHFJPY 4-hour chart
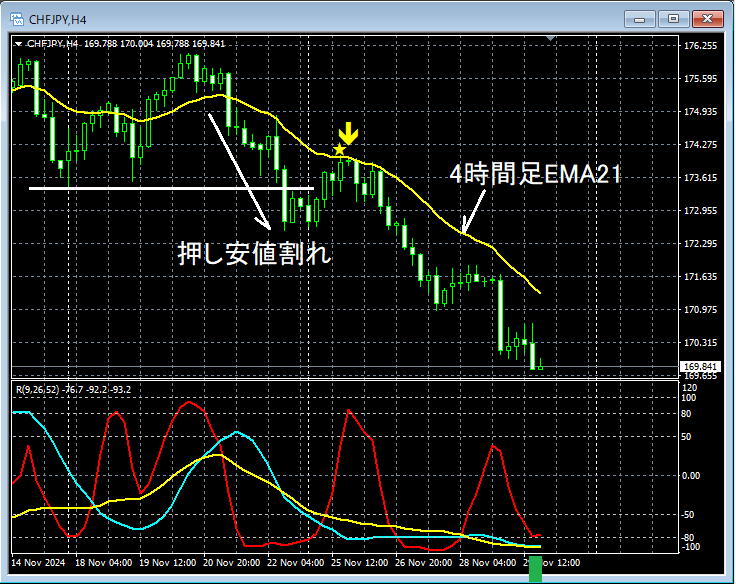
The situation on higher timeframes is omitted. Also,a method that uses RCI to drill down from higher to lower timeframes and wait for mBDSR signals on lower timeframesis explained in detail in the included PDF, so that is omitted here as well.
This article explains using only the 4-hour chart, but in actual trading, when planning a strategy,understanding the higher timeframe conditionsanddrilling down from higher to lower timeframes using RCIis extremely important.
On the above 4-hour timeframe (the lower timeframe in this example),the 4-hour swing low breakafter breaking below, near the4-hour EMA21areathe mBDSR (RCI double-filter) sell signallights up, and the price moves substantially lower. (This is because we are looking at the 4-hour chart as a result of drilling down from higher timeframes, not just randomly looking at the 4-hour chart.)
And theRCI triple-lineforms a shape close toRCI triple bottom
From this example,the close relationship between trading methods focusing on the RCI triple lines, swing lows (Dow Theory), and moving averages, andthe signals from mBDSRis evident.
※Please note that the charts introduced in this article may have added circles, lines, and rectangles for explanatory convenience.
Indicator【BODSOR・mBDSR】that shines when used in combination with RCI
and methodology, case studies (PDF) ★GogoJungle AWARD2020 winner★
https://www.gogojungle.co.jp/tools/indicators/11836
The PDF file includes 358 items (over 1,400 pages, over 470,000 characters in total).
Many of thesedocument how, by logically linking higher and lower timeframes using the RCI triple lines, multiple lower-timeframe conditions are examined sequentially, ultimately waiting for swing-buy or pullback sell timings (i.e., mBDSR signals) on the lower timeframe..
Additionally,many emphasize capturing points where multiple entry reasons align..
Note also thatthere is also a method for exploring upside and downside targets using the RCI triple lines..
In the PDF explanations,over 1,350 chartsare used.

Indicator【BODSOR・mBDSR】that shines when used in combination with RCI
and methodology, case studies (PDF) ★GogoJungle AWARD2020 winner★
https://www.gogojungle.co.jp/tools/indicators/11836
Swiss Franc / Yen CHFJPY 4-hour chart
The situation on higher timeframes is omitted. Also,a method that uses RCI to drill down from higher to lower timeframes and wait for mBDSR signals on lower timeframesis explained in detail in the included PDF, so that is omitted here as well.
This article explains using only the 4-hour chart, but in actual trading, when planning a strategy,understanding the higher timeframe conditionsanddrilling down from higher to lower timeframes using RCIis extremely important.
On the above 4-hour timeframe (the lower timeframe in this example),the 4-hour swing low breakafter breaking below, near the4-hour EMA21areathe mBDSR (RCI double-filter) sell signallights up, and the price moves substantially lower. (This is because we are looking at the 4-hour chart as a result of drilling down from higher timeframes, not just randomly looking at the 4-hour chart.)
And theRCI triple-lineforms a shape close toRCI triple bottom
From this example,the close relationship between trading methods focusing on the RCI triple lines, swing lows (Dow Theory), and moving averages, andthe signals from mBDSRis evident.
※Please note that the charts introduced in this article may have added circles, lines, and rectangles for explanatory convenience.
Indicator【BODSOR・mBDSR】that shines when used in combination with RCI
and methodology, case studies (PDF) ★GogoJungle AWARD2020 winner★
https://www.gogojungle.co.jp/tools/indicators/11836
The PDF file includes 358 items (over 1,400 pages, over 470,000 characters in total).
Many of thesedocument how, by logically linking higher and lower timeframes using the RCI triple lines, multiple lower-timeframe conditions are examined sequentially, ultimately waiting for swing-buy or pullback sell timings (i.e., mBDSR signals) on the lower timeframe..
Additionally,many emphasize capturing points where multiple entry reasons align..
Note also thatthere is also a method for exploring upside and downside targets using the RCI triple lines..
In the PDF explanations,over 1,350 chartsare used.
× ![]()


