

From last week's chart -1: RCI three-line setup, downscaling from higher timeframes to lower timeframes, bullish pressure levels, moving averages, and the signal of mBDSR
0
【Mastering RCI!! Trend Reversal, Buy the Dip, Sell the Rally】
Indicator that shines in combination with RCI: 【BODSOR・mBDSR】
and methods and case studies (PDF) ★GogoJungle AWARD2020 winner★
https://www.gogojungle.co.jp/tools/indicators/11836
NZD/JPY New Zealand Dollar Japanese Yen 4-hour chart
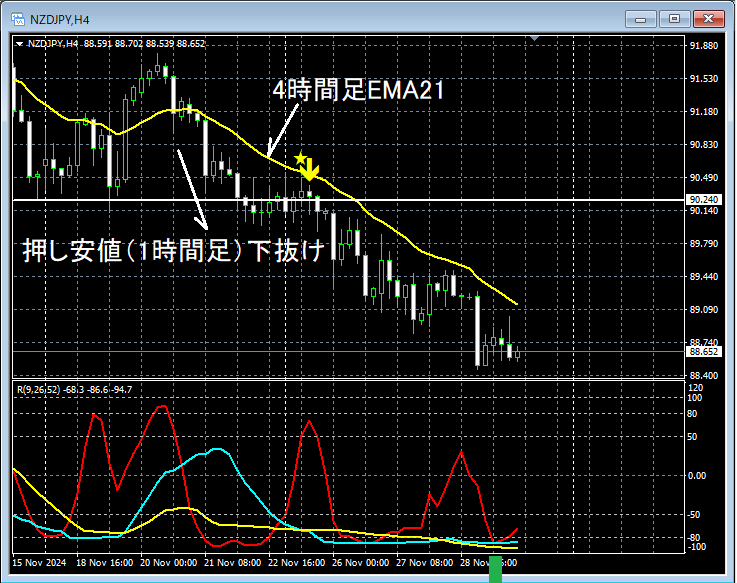
The status of the higher timeframe is omitted. Also,a method that uses RCI to drop from the higher timeframe to the lower timeframe and wait for mBDSR signals on the lower timeframeis explained in detail in the attached PDF, so that also is omitted here.
In this article, the explanation uses only the 4-hour chart, but in actual trading, when formulating a plan,understanding the higher timeframe statusanddrilling down from higher to lower timeframes using RCIis extremely important.
On the upper 4-hour chart (the lower timeframe in this example),the lower break of the 1-hour swing lowis followed bya nearby mBDSR (RCI two-filter) overbought/return sell signalnear thearea,4-hour EMA21indicating a downturn in priceas a result of the drilling down from higher to lower timeframes using RCI (not simply looking at the 4-hour chart). The result of drilling down from higher to lower timeframes using RCI is that we are looking at the 4-hour chart, not randomly focusing on the 4-hour chart.
And,the shape of the three-RCI linesis what is commonly referred to asRCI triple bottom(around the green square). Also,a method to infer the downside target from the behavior of the three RCI lines is explained in the attached PDF.From this example,the high compatibility of trading methods that focus on the RCI three-line, support at rising highs, and moving averageswiththe signals from mBDSRis evident.※Please note that in charts introduced in this article, for convenience of explanation, circles, lines, and rectangles may be added.Indicator that shines in combination with RCI【BODSOR・mBDSR】and methods and case studies (PDF) ★GogoJungle AWARD2020 winner★https://www.gogojungle.co.jp/tools/indicators/11836The PDF file includes 358 documents (over 1,400 pages, over 470,000 words in total).Many of them are summaries of examples that link multiple higher and lower timeframes logically by using the three-line RCI, and ultimately wait for pullbacks or runs on the lower timeframe (i.e., mBDSR signals).Also,many of them focus on identifying points where multiple entry reasons overlap..Additionally,there are also methods to explore upside or downside targets using RCI three-line..In the PDF explanations,more than 1,350 chartsare used.
From this example,the high compatibility of trading methods that focus on the RCI three-line, support at rising highs, and moving averageswiththe signals from mBDSRis evident.
※Please note that in charts introduced in this article, for convenience of explanation, circles, lines, and rectangles may be added.
Indicator that shines in combination with RCI【BODSOR・mBDSR】
and methods and case studies (PDF) ★GogoJungle AWARD2020 winner★
https://www.gogojungle.co.jp/tools/indicators/11836
The PDF file includes 358 documents (over 1,400 pages, over 470,000 words in total).
Many of them are summaries of examples that link multiple higher and lower timeframes logically by using the three-line RCI, and ultimately wait for pullbacks or runs on the lower timeframe (i.e., mBDSR signals).
Also,many of them focus on identifying points where multiple entry reasons overlap..
Additionally,there are also methods to explore upside or downside targets using RCI three-line..
In the PDF explanations,more than 1,350 chartsare used.

Indicator that shines in combination with RCI: 【BODSOR・mBDSR】
and methods and case studies (PDF) ★GogoJungle AWARD2020 winner★
https://www.gogojungle.co.jp/tools/indicators/11836
NZD/JPY New Zealand Dollar Japanese Yen 4-hour chart
The status of the higher timeframe is omitted. Also,a method that uses RCI to drop from the higher timeframe to the lower timeframe and wait for mBDSR signals on the lower timeframeis explained in detail in the attached PDF, so that also is omitted here.
In this article, the explanation uses only the 4-hour chart, but in actual trading, when formulating a plan,understanding the higher timeframe statusanddrilling down from higher to lower timeframes using RCIis extremely important.
On the upper 4-hour chart (the lower timeframe in this example),the lower break of the 1-hour swing lowis followed bya nearby mBDSR (RCI two-filter) overbought/return sell signalnear thearea,4-hour EMA21indicating a downturn in priceas a result of the drilling down from higher to lower timeframes using RCI (not simply looking at the 4-hour chart). The result of drilling down from higher to lower timeframes using RCI is that we are looking at the 4-hour chart, not randomly focusing on the 4-hour chart.
And,the shape of the three-RCI linesis what is commonly referred to asRCI triple bottom(around the green square). Also,a method to infer the downside target from the behavior of the three RCI lines is explained in the attached PDF.From this example,the high compatibility of trading methods that focus on the RCI three-line, support at rising highs, and moving averageswiththe signals from mBDSRis evident.※Please note that in charts introduced in this article, for convenience of explanation, circles, lines, and rectangles may be added.Indicator that shines in combination with RCI【BODSOR・mBDSR】and methods and case studies (PDF) ★GogoJungle AWARD2020 winner★https://www.gogojungle.co.jp/tools/indicators/11836The PDF file includes 358 documents (over 1,400 pages, over 470,000 words in total).Many of them are summaries of examples that link multiple higher and lower timeframes logically by using the three-line RCI, and ultimately wait for pullbacks or runs on the lower timeframe (i.e., mBDSR signals).Also,many of them focus on identifying points where multiple entry reasons overlap..Additionally,there are also methods to explore upside or downside targets using RCI three-line..In the PDF explanations,more than 1,350 chartsare used.
From this example,the high compatibility of trading methods that focus on the RCI three-line, support at rising highs, and moving averageswiththe signals from mBDSRis evident.
※Please note that in charts introduced in this article, for convenience of explanation, circles, lines, and rectangles may be added.
Indicator that shines in combination with RCI【BODSOR・mBDSR】
and methods and case studies (PDF) ★GogoJungle AWARD2020 winner★
https://www.gogojungle.co.jp/tools/indicators/11836
The PDF file includes 358 documents (over 1,400 pages, over 470,000 words in total).
Many of them are summaries of examples that link multiple higher and lower timeframes logically by using the three-line RCI, and ultimately wait for pullbacks or runs on the lower timeframe (i.e., mBDSR signals).
Also,many of them focus on identifying points where multiple entry reasons overlap..
Additionally,there are also methods to explore upside or downside targets using RCI three-line..
In the PDF explanations,more than 1,350 chartsare used.
× ![]()


