

RCI3 main line and moving average that is considered important, double bottom, and R1 R2 S2 and mBDSR signals
【 master RCI!! Trend reversal, buying on dips, selling on rallies 】
Indicator that shows power when combined with RCI【BODSOR・mBDSR】
and techniques・case studies (PDF) ★GogoJungle AWARD2020 winner★
https://www.gogojungle.co.jp/tools/indicators/11836
R1R2S2 is included in the above product. For details, please see the investment navigator+ article below.
RCI three-line “two-stage confirmation” to target trend reversal, buying on dips, and selling on rallies – Release of indicator “R1R2S2”
EURUSD 5-minute chart
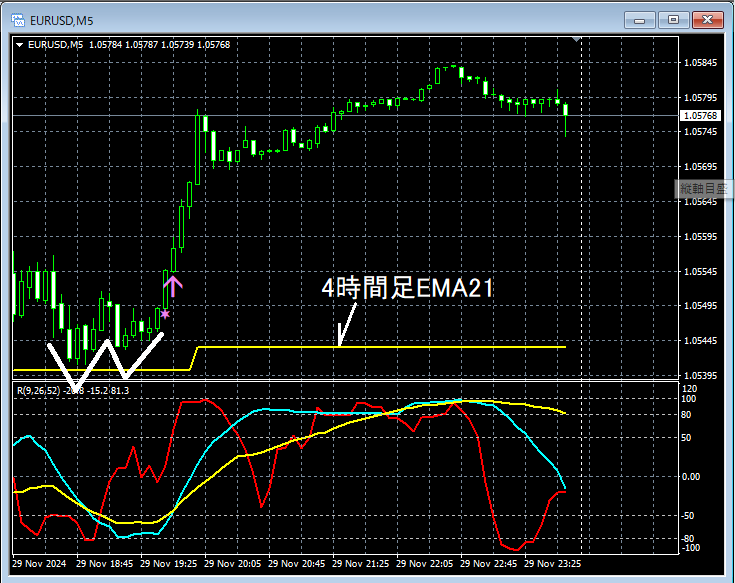
In the 5-minute chart above,price has fallen toward the 4-hour EMA21and formed adouble bottomand rebounded. After that,buy signal from R1R2S2lights up and the price clearly rises.
EURUSD 1-minute chart
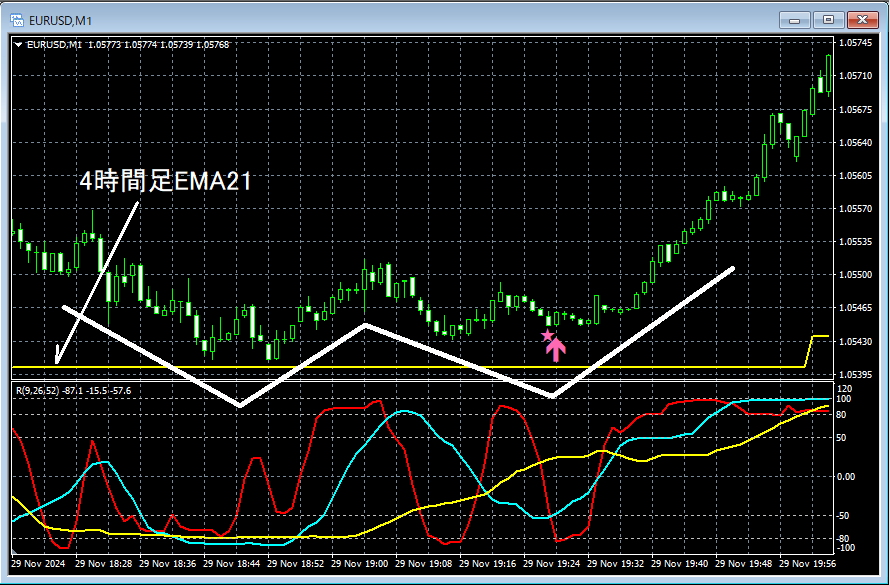
Also, looking at the 1-minute chart above,the right-side valley of the double bottomis where the timing for the upward move beginsthe mBDSR (RCI two-line filter) buy signallights up and the price clearly rises.
From this example,a trading method aiming at buying on dips near moving averagesandthe high compatibility of signals from mBDSR and R1R2S2can be seen.
※Please note that the charts introduced in this article may have circles, lines, rectangles, etc. added for readability.
Indicator that shines when combined with RCI【BODSOR・mBDSR】
and techniques・case studies (PDF) ★GogoJungle AWARD2020 winner★
https://www.gogojungle.co.jp/tools/indicators/11836
The PDF file includes 358 items (over 1,400 pages, over 470,000 characters).
Most of them areexamples that logically link higher and lower timeframes using the three-line RCI, sequentially considering the status of multiple lower timeframes, ultimately waiting for dips or pullbacks as timing in the lower timeframe (i.e., mBDSR signals)..
Also,many emphasize capturing points where multiple entry reasons overlap..
In addition,there are methods to explore upward and downward targets using the RCI three-line..
In the PDF explanations,more than 1,350 chartsare used.

Indicator that shows power when combined with RCI【BODSOR・mBDSR】
and techniques・case studies (PDF) ★GogoJungle AWARD2020 winner★
https://www.gogojungle.co.jp/tools/indicators/11836
R1R2S2 is included in the above product. For details, please see the investment navigator+ article below.
RCI three-line “two-stage confirmation” to target trend reversal, buying on dips, and selling on rallies – Release of indicator “R1R2S2”
EURUSD 5-minute chart
In the 5-minute chart above,price has fallen toward the 4-hour EMA21and formed adouble bottomand rebounded. After that,buy signal from R1R2S2lights up and the price clearly rises.
EURUSD 1-minute chart
Also, looking at the 1-minute chart above,the right-side valley of the double bottomis where the timing for the upward move beginsthe mBDSR (RCI two-line filter) buy signallights up and the price clearly rises.
From this example,a trading method aiming at buying on dips near moving averagesandthe high compatibility of signals from mBDSR and R1R2S2can be seen.
※Please note that the charts introduced in this article may have circles, lines, rectangles, etc. added for readability.
Indicator that shines when combined with RCI【BODSOR・mBDSR】
and techniques・case studies (PDF) ★GogoJungle AWARD2020 winner★
https://www.gogojungle.co.jp/tools/indicators/11836
The PDF file includes 358 items (over 1,400 pages, over 470,000 characters).
Most of them areexamples that logically link higher and lower timeframes using the three-line RCI, sequentially considering the status of multiple lower timeframes, ultimately waiting for dips or pullbacks as timing in the lower timeframe (i.e., mBDSR signals)..
Also,many emphasize capturing points where multiple entry reasons overlap..
In addition,there are methods to explore upward and downward targets using the RCI three-line..
In the PDF explanations,more than 1,350 chartsare used.
× ![]()


