

[Today 2024/11/29 Dollar/Yen攻略] RCI 3-line, support at pullback, and mBDSR pullback selling signal
【Mastering RCI!! Trend Reversal, Buy on Dips, Sell on Rallies】
Indicator that shines in combination with RCI【BODSOR・mBDSR】
Methods・Case Studies (PDF) ★GogoJungle AWARD2020 Winner★
https://www.gogojungle.co.jp/tools/indicators/11836
USD/JPY Daily Chart
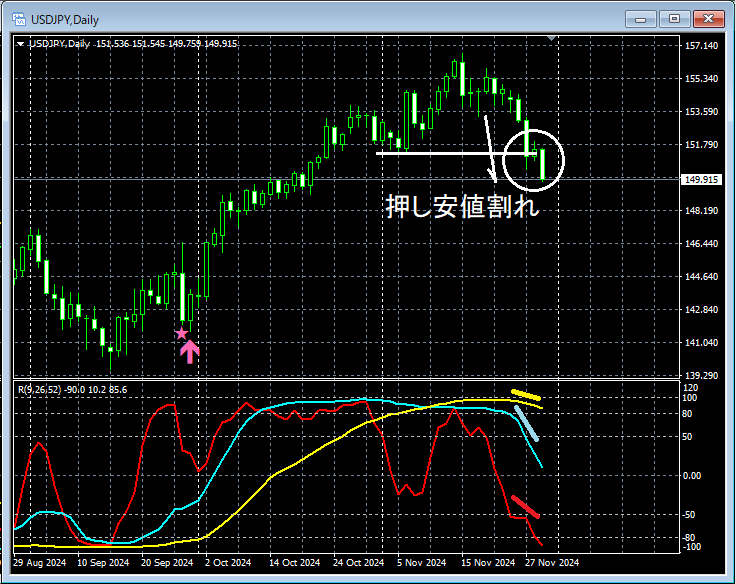
If you look at the area encircled in white on the higher daily chart,all three RCI lines are decliningforming a very weak pattern, and furthermorethe swing low has been broken, so it might not be strange to consider selling rallies on lower timeframes.
USD/JPY 4-Hour Chart
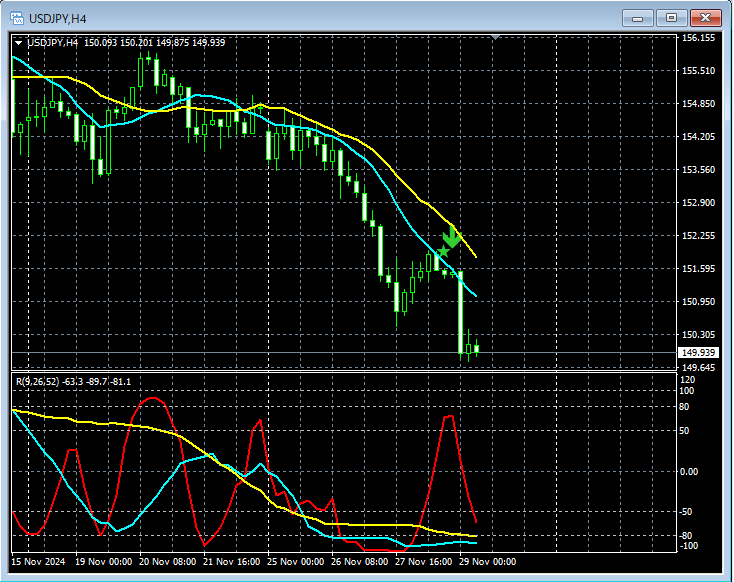
Watching the 4-hour chart above,the mBDSR (two moving average filters) sell signalis lit and the price is clearly moving lower.
USD/JPY 15-Minute Chart
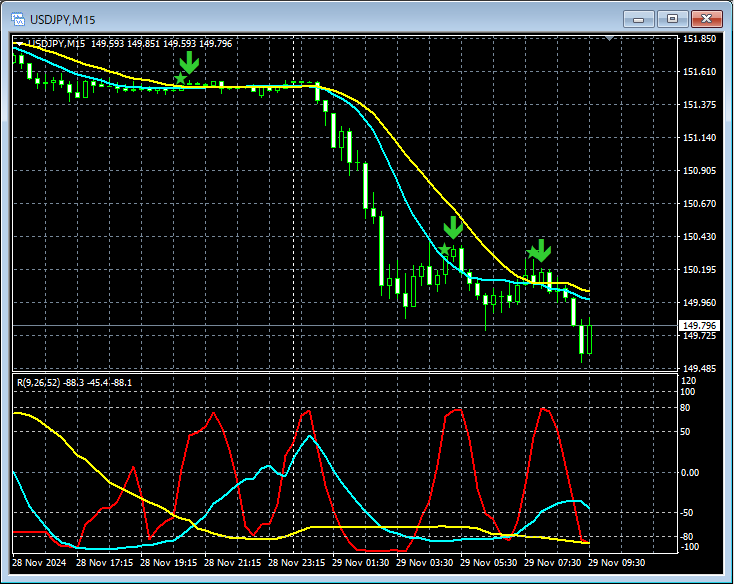
Additionally, looking at the 15-minute chart above, after the 4-hour signal was lit,the mBDSR sell signallights up three times at timely intervals.
From this example,a trading approach focusing on the three-RCI-line alignment and swing lows (Dow Theory)andthe signals of mBDSRshow strong compatibility.
※Note: In the charts introduced in this article, for convenience of explanation, circles, lines, and rectangles may be drawn.
Indicator that shines in combination with RCI【BODSOR・mBDSR】
Methods・Case Studies (PDF) ★GogoJungle AWARD2020 Winner★
https://www.gogojungle.co.jp/tools/indicators/11836
The PDF file is attached with 358 pieces (over 1,400 pages, over 470,000 characters).
Many of them areexamples that detail linking higher and lower timeframes logically using the three-RCI-line setup, sequentially examining multiple lower-timeframe conditions, and ultimately waiting for dip-buying or pullback-selling timing (i.e., mBDSR signals) on the lower timeframe.
Additionally,many focus on identifying points where multiple entry reasons overlap.
Furthermore,there are methods that explore upside and downside targets using the three-RCI-line.
In the PDF explanations,more than 1,350 chartsare used.

Indicator that shines in combination with RCI【BODSOR・mBDSR】
Methods・Case Studies (PDF) ★GogoJungle AWARD2020 Winner★
https://www.gogojungle.co.jp/tools/indicators/11836
USD/JPY Daily Chart
If you look at the area encircled in white on the higher daily chart,all three RCI lines are decliningforming a very weak pattern, and furthermorethe swing low has been broken, so it might not be strange to consider selling rallies on lower timeframes.
USD/JPY 4-Hour Chart
Watching the 4-hour chart above,the mBDSR (two moving average filters) sell signalis lit and the price is clearly moving lower.
USD/JPY 15-Minute Chart
Additionally, looking at the 15-minute chart above, after the 4-hour signal was lit,the mBDSR sell signallights up three times at timely intervals.
From this example,a trading approach focusing on the three-RCI-line alignment and swing lows (Dow Theory)andthe signals of mBDSRshow strong compatibility.
※Note: In the charts introduced in this article, for convenience of explanation, circles, lines, and rectangles may be drawn.
Indicator that shines in combination with RCI【BODSOR・mBDSR】
Methods・Case Studies (PDF) ★GogoJungle AWARD2020 Winner★
https://www.gogojungle.co.jp/tools/indicators/11836
The PDF file is attached with 358 pieces (over 1,400 pages, over 470,000 characters).
Many of them areexamples that detail linking higher and lower timeframes logically using the three-RCI-line setup, sequentially examining multiple lower-timeframe conditions, and ultimately waiting for dip-buying or pullback-selling timing (i.e., mBDSR signals) on the lower timeframe.
Additionally,many focus on identifying points where multiple entry reasons overlap.
Furthermore,there are methods that explore upside and downside targets using the three-RCI-line.
In the PDF explanations,more than 1,350 chartsare used.
× ![]()


