

[15-minute, 5-minute, and 1-minute signs comparison] RCI three-line setup and the moving averages I consider important, bullish price level, and mBDSR signals
【Mastering RCI!! Trend Reversal, Buy on Dips, Sell on Rallies】
Indicator that shines when used in conjunction with RCI: 【BODSOR・mBDSR】
Methods and Case Studies (PDF) ★GogoJungle AWARD2020 Winner★
https://www.gogojungle.co.jp/tools/indicators/11836
USD/CHF Dollar Swiss Franc Daily Chart

On the higher daily chart, the importantDaily EMA21andthe swing low on the 4-hour leveloverlap around, suggesting a potential pullback and a possible rebound. It may not be unreasonable to expect a rebound, but we will carefully look for signs of rebound on lower timeframes.
In this case,Using the three RCI linesallows for a logical, step-by-step (like solving equations or puzzles) translation from daily to lower timeframes, ultimately leading to a setup on the lower timeframe wheremBDSRsignals are waited for, though details are left to the accompanying PDF.
Next, we will look at the 15-minute chart, noting that the choice of the 15-minute chart is deliberate and not incidental.
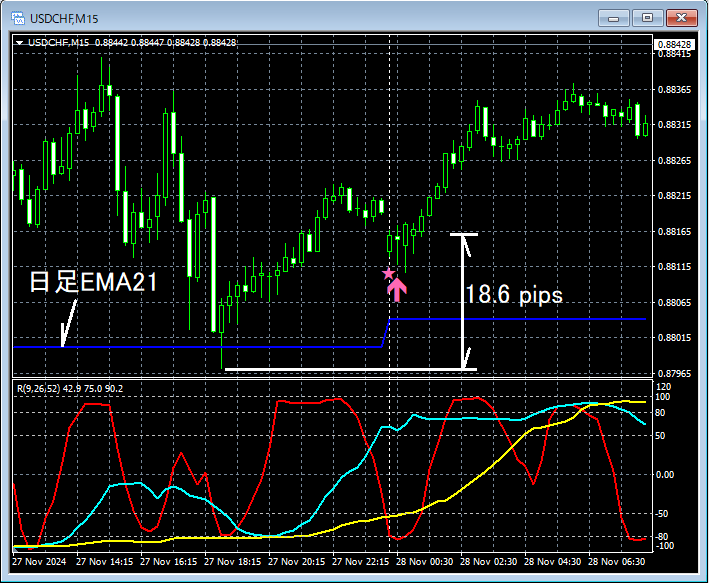
USD/CHF Dollar Swiss Franc 15-Minute Chart
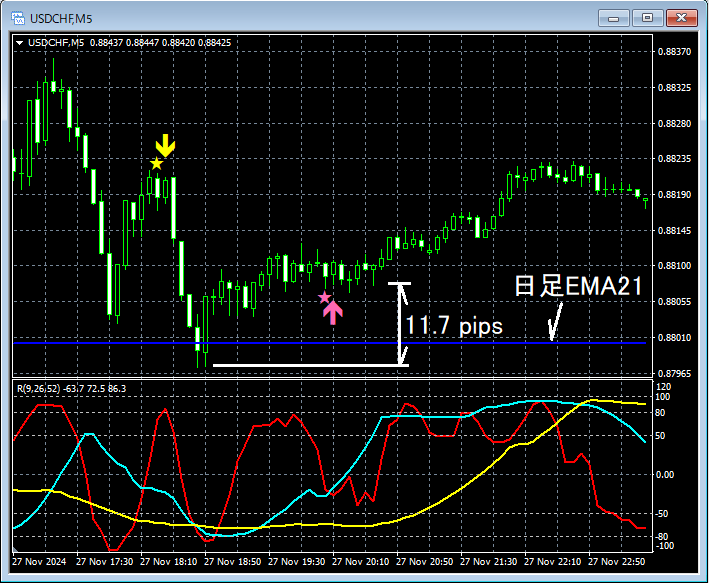
USD/CHF Dollar Swiss Franc 5-Minute Chart
USD/CHF Dollar Swiss Franc 1-Minute Chart
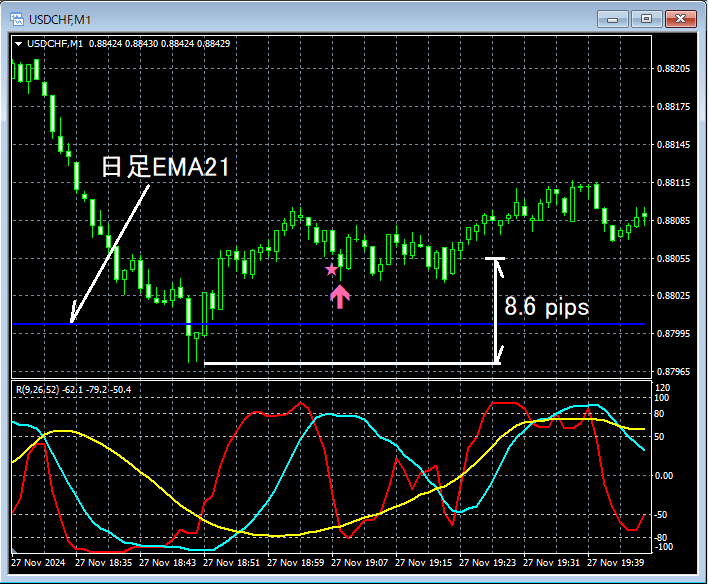
In this case, after signs of rebound near theDaily EMA21appear, on the 15-minute, 5-minute, and 1-minute chartsmBDSR (two RCI lines filter) Buy-on-Dip signalslight up and the price moves up steadily.
At the time of signal, thedistance to the nearest lowas shown on each chart increases in the order of 1-minute, 5-minute, 15-minute, and signals that appeared on the lower timeframes may offermore favorable risk-reward tradespossible.
Rebound around the confluence of the important moving averages and the swing low on the higher timeframeandthe mBDSR buy-on-dip signal lighting uprepresent multiple entry reasons stacking up.
From this example,a trade method focusing on important moving averages and swing lows (Dow theory) andthecompatibility with mBDSR signalsbecomes evident.
※Please note that in the charts introduced in this article, for convenience of explanation, circles, lines, and squares may have been added.
Indicator that shines when used in conjunction with RCI:【BODSOR・mBDSR】
Methods and Case Studies (PDF) ★GogoJungle AWARD2020 Winner★
https://www.gogojungle.co.jp/tools/indicators/11836
The PDF file contains 341 documents (over 1,200 pages, over 430,000 characters in total).
Many of thesedocument how to logically link higher and lower timeframes using the three RCI lines, examining multiple lower timeframes sequentially, and ultimately waiting for a dip buy or a pullback on the lower timeframe (i.e., the mBDSR signals)..
Also,there are many that emphasize identifying points where multiple entry rationales align..
Additionally,there are methods exploring upside and downside targets using three RCI lines..
In the PDF explanations,over 1,200 chartsare used.

Indicator that shines when used in conjunction with RCI: 【BODSOR・mBDSR】
Methods and Case Studies (PDF) ★GogoJungle AWARD2020 Winner★
https://www.gogojungle.co.jp/tools/indicators/11836
USD/CHF Dollar Swiss Franc Daily Chart
On the higher daily chart, the importantDaily EMA21andthe swing low on the 4-hour leveloverlap around, suggesting a potential pullback and a possible rebound. It may not be unreasonable to expect a rebound, but we will carefully look for signs of rebound on lower timeframes.
In this case,Using the three RCI linesallows for a logical, step-by-step (like solving equations or puzzles) translation from daily to lower timeframes, ultimately leading to a setup on the lower timeframe wheremBDSRsignals are waited for, though details are left to the accompanying PDF.
Next, we will look at the 15-minute chart, noting that the choice of the 15-minute chart is deliberate and not incidental.
USD/CHF Dollar Swiss Franc 15-Minute Chart
USD/CHF Dollar Swiss Franc 5-Minute Chart
USD/CHF Dollar Swiss Franc 1-Minute Chart
In this case, after signs of rebound near theDaily EMA21appear, on the 15-minute, 5-minute, and 1-minute chartsmBDSR (two RCI lines filter) Buy-on-Dip signalslight up and the price moves up steadily.
At the time of signal, thedistance to the nearest lowas shown on each chart increases in the order of 1-minute, 5-minute, 15-minute, and signals that appeared on the lower timeframes may offermore favorable risk-reward tradespossible.
Rebound around the confluence of the important moving averages and the swing low on the higher timeframeandthe mBDSR buy-on-dip signal lighting uprepresent multiple entry reasons stacking up.
From this example,a trade method focusing on important moving averages and swing lows (Dow theory) andthecompatibility with mBDSR signalsbecomes evident.
※Please note that in the charts introduced in this article, for convenience of explanation, circles, lines, and squares may have been added.
Indicator that shines when used in conjunction with RCI:【BODSOR・mBDSR】
Methods and Case Studies (PDF) ★GogoJungle AWARD2020 Winner★
https://www.gogojungle.co.jp/tools/indicators/11836
The PDF file contains 341 documents (over 1,200 pages, over 430,000 characters in total).
Many of thesedocument how to logically link higher and lower timeframes using the three RCI lines, examining multiple lower timeframes sequentially, and ultimately waiting for a dip buy or a pullback on the lower timeframe (i.e., the mBDSR signals)..
Also,there are many that emphasize identifying points where multiple entry rationales align..
Additionally,there are methods exploring upside and downside targets using three RCI lines..
In the PDF explanations,over 1,200 chartsare used.
× ![]()


