

[Daily EMA200 Battle] RCI three-line setup, noticeable highs, resistance turned support, double top, mBDSR and mBDSRplus
0
Indicator that shines in combination with RCI: BODSOR・mBDSR
Methods and Case Studies (PDF) ★GogoJungle AWARD2020 Winner★
https://www.gogojungle.co.jp/tools/indicators/11836
【mBDSRplus】
An indicator that excels when used in combination with RCI and moving averages
https://www.gogojungle.co.jp/tools/indicators/18191
EURCAD 15-minute chart
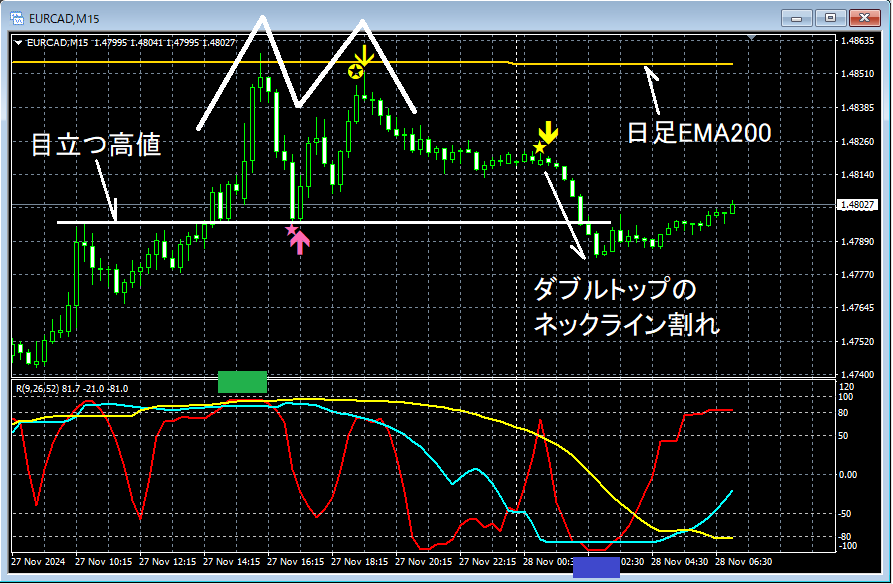
On the 15-minute chart above…
(1) So-calledRCI triple top
(2)Near the Daily EMA200rises but then reverses
(3)Notable highsnear whichmBDSR (RCI double-filter) pullback buy signallights up and climbs(Support/Resistance turn)
(4)Near the Daily EMA200rises
(5)mBDSRplus (RCI double-filter) retest sell signallights up and falls
As a resultthe timing of the start of the decline at the right shoulder of a double top is captured well
(6)mBDSR (RCI double-filter) retest sell signallights up and falls further
(7)Break of the double top's neckline
(8) So-calledRCI double bottom
From this example,a trade method focusing on RCI triple lines, moving averages, notable highs, support/resistance turns, and double tops shows strong compatibility with signals from mBDSR and mBDSRplus.andthe signals from mBDSR and mBDSRplus
Note: Some charts mentioned in this article may have added circles, lines, or squares for explanatory convenience, so please understand.
Indicator that shines in combination with RCI: BODSOR・mBDSR
Methods and Case Studies (PDF) ★GogoJungle AWARD2020 Winner★
https://www.gogojungle.co.jp/tools/indicators/11836
The PDF file includes 358 documents (over 1,400 pages, over 470,000 characters in total).
Many of them are summaries of how to logically link higher and lower timeframes by using the three RCI lines, and ultimately waiting for pullbacks or retracements signals (the mBDSR signals) on the lower timeframe.
In addition,there are many works that emphasize capturing points where multiple entry reasons overlap..
Also included are methods that explore upside/downside targets using the three RCI lines.
In the explanations within the PDF files,over 1,350 charts are used..

Methods and Case Studies (PDF) ★GogoJungle AWARD2020 Winner★
https://www.gogojungle.co.jp/tools/indicators/11836
【mBDSRplus】
An indicator that excels when used in combination with RCI and moving averages
https://www.gogojungle.co.jp/tools/indicators/18191
EURCAD 15-minute chart
On the 15-minute chart above…
(1) So-calledRCI triple top
(2)Near the Daily EMA200rises but then reverses
(3)Notable highsnear whichmBDSR (RCI double-filter) pullback buy signallights up and climbs(Support/Resistance turn)
(4)Near the Daily EMA200rises
(5)mBDSRplus (RCI double-filter) retest sell signallights up and falls
As a resultthe timing of the start of the decline at the right shoulder of a double top is captured well
(6)mBDSR (RCI double-filter) retest sell signallights up and falls further
(7)Break of the double top's neckline
(8) So-calledRCI double bottom
From this example,a trade method focusing on RCI triple lines, moving averages, notable highs, support/resistance turns, and double tops shows strong compatibility with signals from mBDSR and mBDSRplus.andthe signals from mBDSR and mBDSRplus
Note: Some charts mentioned in this article may have added circles, lines, or squares for explanatory convenience, so please understand.
Indicator that shines in combination with RCI: BODSOR・mBDSR
Methods and Case Studies (PDF) ★GogoJungle AWARD2020 Winner★
https://www.gogojungle.co.jp/tools/indicators/11836
The PDF file includes 358 documents (over 1,400 pages, over 470,000 characters in total).
Many of them are summaries of how to logically link higher and lower timeframes by using the three RCI lines, and ultimately waiting for pullbacks or retracements signals (the mBDSR signals) on the lower timeframe.
In addition,there are many works that emphasize capturing points where multiple entry reasons overlap..
Also included are methods that explore upside/downside targets using the three RCI lines.
In the explanations within the PDF files,over 1,350 charts are used..
× ![]()


